
การแสดงผลเชิงภาพ (Visualization) และการรายงาน (Reporting)
SAS Visual Analytics
ตอนนี้ทุกคนสามารถค้นพบและแบ่งปันข้อมูลเชิงลึกอันทรงพลังที่สร้างแรงบันดาลใจในการดำเนินการได้อย่างง่ายดาย
แอปพลิเคชันเดียวสำหรับการรายงาน การสำรวจข้อมูล และการวิเคราะห์

ดูภาพรวม - และจุดเชื่อมต่อที่ซ่อนอยู่
ระบุความสัมพันธ์ที่สำคัญในข้อมูลของคุณได้อย่างรวดเร็ว โดยใช้คำแนะนำและค่าตัวเลขทางธุรกิจที่เกี่ยวข้องซึ่งได้รับการระบุอย่างชัดเจนแล้ว ใช้การเรียนรู้ของเครื่องและคำอธิบายในภาษามนุษย์เพื่อค้นหา แสดงผลด้วยภาพ ตลอดจนบรรยายเรื่องราวและข้อมูลเชิงลึกที่เข้าใจและอธิบายได้ง่าย หาคำตอบว่าทำไมจึงเกิดเหตุการณ์บางอย่างขึ้น ตรวจสอบทุกตัวเลือกและหาโอกาสที่ซ่อนอยู่ในข้อมูลของคุณ เน้นจุดสำคัญ ค่าผิดปกติ คลัสเตอร์ และอื่นๆ โดยอัตโนมัติ เพื่อเปิดเผยข้อมูลเชิงลึกที่สำคัญที่ช่วยจุดประกายให้เกิดแรงบันดาลใจในการดำเนินการ
เปลี่ยนการมองเห็นเป็นการเข้าใจด้วยภาพแสดงแบบไดนามิก
สร้างรายงานและแดชบอร์ดแบบอินเทอร์แอคทีฟที่น่าทึ่ง สรุปเมตริกประสิทธิภาพหลักอย่างรวดเร็วและแชร์ผ่านเว็บและอุปกรณ์เคลื่อนที่ ผู้บริหารและพนักงานระดับแนวหน้าสามารถโต้ตอบและทำงานร่วมกันได้อย่างรวดเร็วเกี่ยวกับข้อมูลเชิงลึก แบ่งส่วนและลูกเต๋าเพื่อค้นหาคำตอบของตนเอง และเข้าใจประสิทธิภาพของธุรกิจได้ดียิ่งขึ้น


รับคำตอบที่มีข้อมูลสนับสนุน ผลลัพธ์ที่ขับเคลื่อนด้วยข้อมูลเชิงลึก
แม้แต่นักวิเคราะห์ธุรกิจทั่วไปที่ไม่ชำนาญทางเทคนิคก็สามารถประเมินสถานการณ์ และตัดสินใจได้อย่างมีเหตุผลจากข้อมูลที่เชื่อถือได้ ด้วยระบบการคาดการณ์และวิเคราะห์ล่วงหน้าที่ใช้งานได้ง่ายของเรา – โดยไม่จำเป็นต้องเขียนโปรแกรมใด ๆ พร้อมอัลกอริธึมอัจฉริยะที่ช่วยคุณลดเวลาในการลองผิดลองถูก ซึ่งคุณยังสามารถทำงานร่วมกันกับผู้เชี่ยวชาญอื่น ๆ เพื่อวิเคราะห์เหตุการณ์และตัวแปรที่สำคัญที่สุดในขณะนั้น
เพิ่มมิติด้านพื้นที่และตำแหน่งทางกายภาพให้แก่ทุกเหตุการณ์
เพิ่มบริบททางภูมิศาสตร์ในการวิเคราะห์และการแสดงภาพด้วยการผสานการทำงานข้อมูลดั้งเดิมเข้ากับข้อมูลตำแหน่ง การวิเคราะห์สถานที่นำมิติข้อมูล "ที่ไหน" มาสู่ระดับแนวหน้า คุณจึงสามารถวิเคราะห์ข้อมูลด้วยวิธีใหม่ๆ เพื่อให้ได้ภาพรวมทั้งหมดก่อนตัดสินใจ ขณะที่ระบุโอกาสเฉพาะสถานที่


เพิ่มความคล่องตัวในกระบวนการทำงาน
การเตรียมข้อมูลแบบบริการตนเองช่วยให้ผู้ใช้ทางธุรกิจสามารถนำเข้าข้อมูลของตนเอง เข้าร่วมตาราง ใช้ฟังก์ชันคุณภาพข้อมูล สร้างคอลัมน์จากการคำนวณ และอื่นๆ ทั้งหมดนี้ทำได้ง่ายด้วยการลากและวาง SAS Visual Analytics อำนวยความสะดวกด้านการนำการวิเคราะห์ไปใช้ในวงกว้างและรวดเร็วยิ่งขึ้นสำหรับทั้งองค์กรของคุณ ด้วยการให้อำนาจผู้ใช้ในการเข้าถึง รวม ล้างข้อมูล และเตรียมข้อมูลของตนเองด้วยวิธีที่คล่องตัวและเชื่อถือได้
รับข้อมูลเชิงลึกจากการแชท
คุณสามารถสร้างและใช้งานแชทบอทแบบปรับแต่งตามชอบซึ่งสื่อสารด้วยภาษามนุษย์ด้วยอินเทอร์เฟซการสร้างผ่านภาพซึ่งแทบไม่จำเป็นต้องเขียนโค้ด และยังใช้งานง่าย โดยแชทบอทจะตอบกลับ เข้าถึงข้อมูล ทำรายงาน และนำเสนอด้วยรูปภาพ รวมถึงยังสามารถวิเคราะห์และใช้ AI ผ่านอินเทอร์เฟซที่แสดงด้วยการสนทนาในภาษามนุษย์ คุณสามารถกำหนดค่าให้บอทได้ใน SAS เพื่อเข้าถึงข้อมูลเชิงลึกได้ง่ายยิ่งขึ้น หรือเชื่อมต่อบอทเข้ากับบริการภายนอกเพื่อให้บุคคลอื่นได้ใช้งานด้วย ทำให้การค้นหาข้อมูลเชิงลึกเป็นเรื่องง่ายเหมือนส่งข้อความแชท


ใช้ประโยชน์จากส่วนที่ดีที่สุดของทั้งสองแพลตฟอร์ม
ใช้เครื่องมือเพื่อประสิทธิภาพการทำงานของ Microsoft จาก Microsoft 365 เพื่อเข้าถึงการวิเคราะห์จาก SAS อย่างราบรื่น เจาะลึกข้อมูล เข้าถึงและโต้ตอบกับรายงานใน SAS Visual Analytics และฝังข้อมูลเชิงลึกในแอปพลิเคชัน Microsoft เช่น Excel และ Outlook อีกทั้งยังสามารถแบ่งปันกับเพื่อนร่วมงานที่ใกล้ชิดได้ด้วย


SAS Visual Analytics ได้รับรางวัลเครื่องหมาย 'Users Love Us' จาก G2

คุณสมบัติเด่น
การรายงานเชิงโต้ตอบ ( Interactive reporting ) การค้นพบเชิงรูปภาพ ( Visual discover ) การวิเคราะห์ด้วยตัวเอง ( Self-service analytics ) ปรับขนาดได้และครอบคลุม ( Scalability and governance ) ทั้งหมดนี้รวมอยู่ในสภาพแวดล้อมความจำที่ทรงพลัง
การเข้าถึงข้อมูล การจัดเตรียมข้อมูล และคุณภาพของข้อมูล
เข้าถึง สร้างโปรไฟล์ ทำความสะอาด และแปลงข้อมูลโดยใช้อินเทอร์เฟซที่ใช้งานง่ายซึ่งมีความสามารถในการเตรียมข้อมูลแบบบริการตนเองด้วย AI แบบฝัง
การสร้างแชทบอทแบบกำหนดเอง
สร้างและปรับใช้แชทบอทแบบกำหนดเองที่ใช้ภาษาธรรมชาติผ่านอินเทอร์เฟซการทำงานแบบแสดงผลด้วยภาพและใช้การเขียนโค้ดน้อย เพื่อหาข้อมูลเชิงลึกโดยแชทบอทและให้ประสบการณ์แก่ผู้ใช้ผ่านการสนทนา
Data Visualization
สำรวจข้อมูลด้วยภาพและสร้างและแชร์การแสดงภาพอัจฉริยะและรายงานแบบอินเทอร์แอคทีฟผ่านอินเทอร์เฟซแบบบริการตนเองเพียงอินเทอร์เฟซเดียว การวิเคราะห์ฉบับปรับปรุงและความสามารถขั้นสูงช่วยเร่งข้อมูลเชิงลึกและช่วยให้คุณค้นพบเรื่องราวที่ซ่อนอยู่ในข้อมูลของคุณ
แดชบอร์ดแบบอินเทอร์แอคทีฟ รายงาน BI และการวิเคราะห์
ดำเนินงานโดยตรงตั้งแต่การรายงานและการสำรวจ การวิเคราะห์ ไปจนถึงการแบ่งปันข้อมูลผ่านช่องทางต่าง ๆ รวมถึงแอปพลิเคชันของ Microsoft Office ด้วยอินเทอร์เฟซเดียว
การวิเคราะห์ด้วยตนเอง
การพยากรณ์อัตโนมัติ การค้นหาค่าเป้าหมาย การวิเคราะห์สถานการณ์สมมติ ทรีการตัดสินใจ และอื่นๆ อยู่ใกล้แค่ปลายนิ้ว ไม่ว่าทักษะของคุณจะอยู่ระดับใดก็ตาม
การวิเคราะห์ข้อความ
รับข้อมูลเชิงลึกจากโซเชียลมีเดียและข้อมูลข้อความอื่นๆ และรู้ว่าความรู้สึกเป็นบวกหรือลบ
การวิเคราะห์ตำแหน่งที่ตั้ง
คุณสามารถผสมผสานชุดข้อมูลในรูปแบบปกติ (เช่น ข้อมูลการทำธุรกรรม ข้อมูลลูกค้า ข้อมูลการดำเนินการ และอื่น ๆ) เข้ากับข้อมูลสถานที่และเพื่อการวิเคราะห์ภูมิศาสตร์
การวิเคราะห์ที่เพิ่มขึ้น
ค้นพบเรื่องจริงที่ซ่อนอยู่ในข้อมูลของคุณโดยใช้เวลาไม่กี่วินาที ซอฟต์แวร์จะให้คำแนะนำและระบุค่าตัวเลขทางธุรกิจที่เกี่ยวข้องโดยอัตโนมัติ
ข้อมูลเชิงลึกแบบฝังแล้ว
ฝังข้อมูลเชิงลึกแบบแสดงผลด้วยภาพจากรายงาน SAS Visual Analytics รวมถึงสร้างเรื่องราวแบบอินเทอร์แอคทีฟ หรือฝังทั้งรายงานหรือหน้ารายงานแบบอินเทอร์แอคทีฟลงในแอปพลิเคชันบนเว็บที่คุณกำหนดเอง เผยแพร่ข้อมูลเชิงลึกที่ขยายขนาดตามความยืดหยุ่นของสแนปช็อตข้อมูลแบบสดหรือข้อมูลที่ฝังแล้วเพื่อบอกเล่าเรื่องราวของข้อมูล
แอป SAS Visual Analytics สำหรับอุปกรณ์เคลื่อนที่
ใช้แอปมือถือแบบเนทีฟสำหรับ iOS และ Android เพื่อดูและโต้ตอบกับผู้อื่นผ่านรายงานแบบไดนามิกและแดชบอร์ดบนแท็บเล็ตและสมาร์ทโฟน
การผสานงานทำงานแบบเปิดสำหรับผู้พัฒนา
แทรกการนำเสนอด้วยรูปภาพที่เปี่ยมความคิดสร้างสรรค์ด้วยไลบรารีจาวาสคริปต์จากภายนอก เช่น D3 และ C3 โดยสามารถโต้ตอบได้อย่างเต็มรูปแบบใน SAS Visual Analytics และใช้ประโยชน์จากทรัพยากรในการพัฒนาโอเพ่นซอร์สสำหรับนักพัฒนา และ REST API สำหรับทุกภาษาไคลเอนต์เพื่อเข้าถึงการวิเคราะห์ ข้อมูล และบริการของ SAS
คลาวด์เนทีฟ
สถาปัตยกรรมของ SAS Viya มีขนาดกะทัดรัด เป็นระบบคลาวด์เนทีฟ และรวดเร็ว ไม่ว่าคุณจะต้องการใช้ SAS Cloud หรือผู้ให้บริการคลาวด์สาธารณะหรือส่วนตัว คุณจะได้รับประโยชน์สูงสุดจากการลงทุนบนคลาวด์ของคุณ
การผสานการทำงานกับ Microsoft 365
การผสานการทำงานอย่างราบรื่นระหว่าง SAS สำหรับ Microsoft 365 และ SAS Viya ช่วยให้คุณสามารถฝังข้อมูลเชิงลึกเพื่อการวิเคราะห์ที่มีประสิทธิภาพจาก SAS ภายในแอปพลิเคชัน Microsoft 365 ได้ จึงทำให้ทำงานร่วมกันและนำไปสู่การตัดสินใจจากข้อมูลได้ดียิ่งขึ้น
การรองรับภาษาอื่น
ภาษาที่รองรับได้แก่ ญี่ปุ่น เกาหลี จีนตัวย่อ จีนตัวเต็ม ไทย เยอรมัน สเปน ฝรั่งเศส อิตาลี โปแลนด์ รัสเซีย อาหรับ เช็ก เดนมาร์ก อังกฤษ กรีก โครเอเชีย ฮังการี ฮิบรู นอร์วีเจียนบูกโมล ดัตช์ นอร์เวย์ โปรตุเกสบราซิล โปรตุเกส สโลวาเกีย สโลวีเนีย เซอร์เบีย สวีเดน และตุรกี

การสาธิตแบบอินเทอร์แอคทีฟ
ลองชมการสาธิตแบบอินเทอร์แอคทีฟของ SAS Visual Analytics เหล่านี้เพื่อดูว่าคุณสามารถสำรวจและทำความเข้าใจข้อมูลได้อย่างรวดเร็วและง่ายดายเพียงใดเพื่อแก้ไขปัญหาต่างๆ ของอุตสาหกรรมและธุรกิจ
-
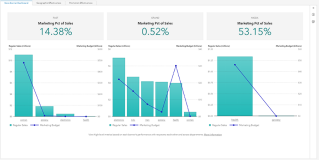 Retail and Consumer Goods
ความเข้าใจอย่างถ่องแท้ต่อธุรกิจค้าปลีกวิเคราะห์ความสามารถของร้านค้าในระดับภูมิภาค และก่อให้เกิดการใช้ข้อมูลเพื่อการตัดสินใจเกี่ยวกับธุรกิจค้าปลีก
Retail and Consumer Goods
ความเข้าใจอย่างถ่องแท้ต่อธุรกิจค้าปลีกวิเคราะห์ความสามารถของร้านค้าในระดับภูมิภาค และก่อให้เกิดการใช้ข้อมูลเพื่อการตัดสินใจเกี่ยวกับธุรกิจค้าปลีก
-
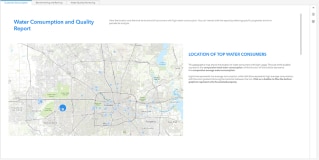 พลังงานและสาธารณูปโภค
ปริมาณการบริโภคและคุณภาพของน้ำตรวจสอบคุณภาพและการใช้ทรัพยากรธรรมชาติที่จำเป็น
พลังงานและสาธารณูปโภค
ปริมาณการบริโภคและคุณภาพของน้ำตรวจสอบคุณภาพและการใช้ทรัพยากรธรรมชาติที่จำเป็น
-
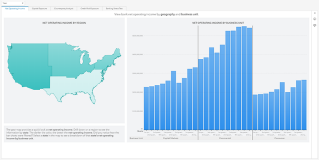 ภาคการธนาคาร
Banking & Risk InsightsGet a holistic view of risk and performance across regions, down to the individual counterparty level.
ภาคการธนาคาร
Banking & Risk InsightsGet a holistic view of risk and performance across regions, down to the individual counterparty level.
SAS Viya เป็นระบบคลาวด์เนทีฟและรองรับระบบคลาวด์อื่นๆ
ใช้ SAS ตามที่คุณต้องการ – จัดการโดย SAS หรือจัดการด้วยตนเอง และในที่ที่คุณต้องการ


สำรวจเพิ่มเติมเกี่ยวกับ SAS Visual Analytics และอื่นๆ
หากต้องการเรียกดูทรัพยากรตามประเภท ให้เลือกตัวเลือกด้านล่าง
-
- เลือกประเภทของแหล่งข้อมูล
- Book Excerpt
- Case Study
- E-Book
- Infographic
- Interview
- Research
- Series
- Video
- Webinar
- White Paper
- การรายงานโดยนักวิเคราะห์
- บทความ
- โพสท์จากบล็อก
- เรื่องราวจากลูกค้าของเรา
-
 E-Book
Decisions you can trust: A strategic guide to trustworthy data and AI decision makingDiscover how decision intelligence ensures AI agents act with context, ethics and transparency – delivering scalable, auditable and trusted outcomes.
E-Book
Decisions you can trust: A strategic guide to trustworthy data and AI decision makingDiscover how decision intelligence ensures AI agents act with context, ethics and transparency – delivering scalable, auditable and trusted outcomes.
-
 E-Book
Government navigating an uncertain worldHow governments can harness data,
advanced analytics, and trustworthy AI to
prepare for the unexpected—and respond
faster to protect and improve citizens’ lives.
E-Book
Government navigating an uncertain worldHow governments can harness data,
advanced analytics, and trustworthy AI to
prepare for the unexpected—and respond
faster to protect and improve citizens’ lives.
-
 เรื่องราวจากลูกค้าของเรา
Award-winning bank’s data-driven strategy boosts productivity, efficiency and customer centricityAn ‘analytics for all’ approach helps Banca Intesa Beograd foster informed decision making, innovation and sustainable growth.
เรื่องราวจากลูกค้าของเรา
Award-winning bank’s data-driven strategy boosts productivity, efficiency and customer centricityAn ‘analytics for all’ approach helps Banca Intesa Beograd foster informed decision making, innovation and sustainable growth.
-
 เรื่องราวจากลูกค้าของเรา
AI helps students graduate from collegeHillsborough (FL) Community College uses SAS® Visual Analytics to determine what students need to complete their degrees
เรื่องราวจากลูกค้าของเรา
AI helps students graduate from collegeHillsborough (FL) Community College uses SAS® Visual Analytics to determine what students need to complete their degrees
-
 เรื่องราวจากลูกค้าของเรา
Jakarta Smart City uses IoT analytics to better serve residentsJakarta and SAS team up to create an award-winning approach to public services and disaster management.
เรื่องราวจากลูกค้าของเรา
Jakarta Smart City uses IoT analytics to better serve residentsJakarta and SAS team up to create an award-winning approach to public services and disaster management.
-
 เรื่องราวจากลูกค้าของเรา
Managing Dutch roads and waterways with intelligenceA modern AI, IoT and analytics platform powered by SAS Viya helps Rijkswaterstaat move from reactive to predictive infrastructure maintenance.
เรื่องราวจากลูกค้าของเรา
Managing Dutch roads and waterways with intelligenceA modern AI, IoT and analytics platform powered by SAS Viya helps Rijkswaterstaat move from reactive to predictive infrastructure maintenance.
-
 เรื่องราวจากลูกค้าของเรา
Customer Story
Advanced analytics helps policymakers determine how new tax measures would affect citizensAscertaining the ‘winners’ and ‘losers’ of potential tax changes before regulations are implemented.
เรื่องราวจากลูกค้าของเรา
Customer Story
Advanced analytics helps policymakers determine how new tax measures would affect citizensAscertaining the ‘winners’ and ‘losers’ of potential tax changes before regulations are implemented.
-
 เรื่องราวจากลูกค้าของเรา
Optimizing cancer patient care with advanced analyticsSAS Viya helps create custom care pathways for Oscar Lambret Center cancer patients.
เรื่องราวจากลูกค้าของเรา
Optimizing cancer patient care with advanced analyticsSAS Viya helps create custom care pathways for Oscar Lambret Center cancer patients.
-
 เรื่องราวจากลูกค้าของเรา
Automated safety reporting protects hospital patients in NorwayHelse Nord uses SAS to automate its hospitals’ processes and halves their workload.
เรื่องราวจากลูกค้าของเรา
Automated safety reporting protects hospital patients in NorwayHelse Nord uses SAS to automate its hospitals’ processes and halves their workload.
-
 เรื่องราวจากลูกค้าของเรา
Taking the guesswork out of production planningEuramax uses SAS to prevent production delays
เรื่องราวจากลูกค้าของเรา
Taking the guesswork out of production planningEuramax uses SAS to prevent production delays
-
 เรื่องราวจากลูกค้าของเรา
Hospitals save time and money with real-time medical device tracking Jan Yperman Hospital uses Blyott and SAS Visual Analytics on SAS Viya to monitor hospital asset locations and ensure optimal purchasing decisions.
เรื่องราวจากลูกค้าของเรา
Hospitals save time and money with real-time medical device tracking Jan Yperman Hospital uses Blyott and SAS Visual Analytics on SAS Viya to monitor hospital asset locations and ensure optimal purchasing decisions.
-
 เรื่องราวจากลูกค้าของเรา
One airport operator is making every journey personal for passengersiGA Istanbul Airport creates personalized customer journeys using SAS® MarTech solutions
เรื่องราวจากลูกค้าของเรา
One airport operator is making every journey personal for passengersiGA Istanbul Airport creates personalized customer journeys using SAS® MarTech solutions
-
 เรื่องราวจากลูกค้าของเรา
Improving data collection and modeling to accelerate predictive medicine effortsDompé farmaceutici uses SAS for predictive analytics and quantitative disease modeling.
เรื่องราวจากลูกค้าของเรา
Improving data collection and modeling to accelerate predictive medicine effortsDompé farmaceutici uses SAS for predictive analytics and quantitative disease modeling.
-
 เรื่องราวจากลูกค้าของเรา
Enhancing road safety with advanced analyticsBelgium’s FPS Justice uses insights from SAS Visual Analytics to crack down on excessive speeding and take more effective action against traffic violators.
เรื่องราวจากลูกค้าของเรา
Enhancing road safety with advanced analyticsBelgium’s FPS Justice uses insights from SAS Visual Analytics to crack down on excessive speeding and take more effective action against traffic violators.
-
 เรื่องราวจากลูกค้าของเรา
Ensuring public transparency and one-stop access to crime data and analysisThe North Carolina Criminal Justice Analysis Center uses SAS Viya on SAS Cloud to improve data accessibility and efficiencies in gathering and reporting state and county criminal justice statistics to stakeholders, policymakers and citizens.
เรื่องราวจากลูกค้าของเรา
Ensuring public transparency and one-stop access to crime data and analysisThe North Carolina Criminal Justice Analysis Center uses SAS Viya on SAS Cloud to improve data accessibility and efficiencies in gathering and reporting state and county criminal justice statistics to stakeholders, policymakers and citizens.
-
 เรื่องราวจากลูกค้าของเรา
Making prisons and communities safer with data visualizationIowa Department of Corrections uses SAS Viya on SAS Cloud to better manage supervised populations, make informed decisions and improve public safety.
เรื่องราวจากลูกค้าของเรา
Making prisons and communities safer with data visualizationIowa Department of Corrections uses SAS Viya on SAS Cloud to better manage supervised populations, make informed decisions and improve public safety.
-
 บทความ
Are you good at scoring?Credit scoring is the foundation for evaluating clients who apply for a loan (or other types of exposure for the bank). It is not unusual for it to take up to 12 months to build and deploy a new credit scoring model. Reforming the process will help minimize losses, increase earnings and reduce operational risk.
บทความ
Are you good at scoring?Credit scoring is the foundation for evaluating clients who apply for a loan (or other types of exposure for the bank). It is not unusual for it to take up to 12 months to build and deploy a new credit scoring model. Reforming the process will help minimize losses, increase earnings and reduce operational risk.
-
 เรื่องราวจากลูกค้าของเรา
One of the largest multi-sport clubs in Portugal aims to win big with analyticsSport Lisboa e Benfica modernizes its operations with SAS Analytics, as it looks to expand internationally.
เรื่องราวจากลูกค้าของเรา
One of the largest multi-sport clubs in Portugal aims to win big with analyticsSport Lisboa e Benfica modernizes its operations with SAS Analytics, as it looks to expand internationally.
-
 เรื่องราวจากลูกค้าของเรา
Analytics helps major public health system run efficient programs and improve patient careThe Los Angeles County Department of Health Services relies on advanced analytics from SAS to meet federal regulations, ensure financial viability and better serve a diverse population of more than 10 million people.
เรื่องราวจากลูกค้าของเรา
Analytics helps major public health system run efficient programs and improve patient careThe Los Angeles County Department of Health Services relies on advanced analytics from SAS to meet federal regulations, ensure financial viability and better serve a diverse population of more than 10 million people.
-
 เรื่องราวจากลูกค้าของเรา
It’s all in the research: Using AI to solve issues in health careWith the University of Alberta's new health data management and analysis platform, DARC, it can now increase research capacity and provide high-performance computing and data storage in a secure environment. SAS provided the university software to help make its platform thrive amidst a global pandemic.
เรื่องราวจากลูกค้าของเรา
It’s all in the research: Using AI to solve issues in health careWith the University of Alberta's new health data management and analysis platform, DARC, it can now increase research capacity and provide high-performance computing and data storage in a secure environment. SAS provided the university software to help make its platform thrive amidst a global pandemic.
-
 เรื่องราวจากลูกค้าของเรา
Analytic models spotlight risky loansItaly’s Ministry of Economy and Finance uses advanced analytics on SAS Viya to quickly calculate risk on financial guarantees.
เรื่องราวจากลูกค้าของเรา
Analytic models spotlight risky loansItaly’s Ministry of Economy and Finance uses advanced analytics on SAS Viya to quickly calculate risk on financial guarantees.
-
 เรื่องราวจากลูกค้าของเรา
Italy’s second-largest hospital uses advanced analytics for effective pandemic responseGemelli University Hospital uses SAS solutions to predict admissions of patients in the intensive care units and impacts on the organization, from staffing hospital wards to effectively scheduling and managing COVID-19 vaccine administration.
เรื่องราวจากลูกค้าของเรา
Italy’s second-largest hospital uses advanced analytics for effective pandemic responseGemelli University Hospital uses SAS solutions to predict admissions of patients in the intensive care units and impacts on the organization, from staffing hospital wards to effectively scheduling and managing COVID-19 vaccine administration.
-
 เรื่องราวจากลูกค้าของเรา
Finland’s top retail bank applies AI to improve customer service and credit scoringS-Bank provides better customer service and faster, more accurate loan processing time using SAS Viya on Azure.
เรื่องราวจากลูกค้าของเรา
Finland’s top retail bank applies AI to improve customer service and credit scoringS-Bank provides better customer service and faster, more accurate loan processing time using SAS Viya on Azure.
-
 เรื่องราวจากลูกค้าของเรา
Real-time analytics helps telecom provider adapt to changing customer needs during global pandemic and beyondTelefónica Ecuador accelerates digital transformation, improves campaigns and achieves growth via intelligent decisioning powered by SAS.
เรื่องราวจากลูกค้าของเรา
Real-time analytics helps telecom provider adapt to changing customer needs during global pandemic and beyondTelefónica Ecuador accelerates digital transformation, improves campaigns and achieves growth via intelligent decisioning powered by SAS.
-
 เรื่องราวจากลูกค้าของเรา
Transforming the consumer banking experience through advanced analyticsCIMB Singapore uses SAS Viya to enhance business operations and keep pace with changing customer needs.
เรื่องราวจากลูกค้าของเรา
Transforming the consumer banking experience through advanced analyticsCIMB Singapore uses SAS Viya to enhance business operations and keep pace with changing customer needs.
-
 เรื่องราวจากลูกค้าของเรา
Delivery company relies on analytics to optimize logistics and swiftly meet changing marketplace dynamicsRelais Colis reinvents itself during global pandemic using SAS Visual Analytics to ensure continuity of business and quality of service.
เรื่องราวจากลูกค้าของเรา
Delivery company relies on analytics to optimize logistics and swiftly meet changing marketplace dynamicsRelais Colis reinvents itself during global pandemic using SAS Visual Analytics to ensure continuity of business and quality of service.
-
 เรื่องราวจากลูกค้าของเรา
Reaching 3.6 million football fans via comprehensive marketing analyticsThe Royal Dutch Football Federation relies on SAS Customer Intelligence 360 to better understand what motivates players and fans, engage audiences with personalized communications, and promote the love of the game.
เรื่องราวจากลูกค้าของเรา
Reaching 3.6 million football fans via comprehensive marketing analyticsThe Royal Dutch Football Federation relies on SAS Customer Intelligence 360 to better understand what motivates players and fans, engage audiences with personalized communications, and promote the love of the game.
-
 เรื่องราวจากลูกค้าของเรา
Analytics helps ensure fair and balanced pay structures across Sweden’s public sectorTietoEVRY and SAS partner to help Sweden's largest employer organization, Adda, offer a nationally aggregated salary planning tool for municipalities and regions across the country.
เรื่องราวจากลูกค้าของเรา
Analytics helps ensure fair and balanced pay structures across Sweden’s public sectorTietoEVRY and SAS partner to help Sweden's largest employer organization, Adda, offer a nationally aggregated salary planning tool for municipalities and regions across the country.
-
 Webinar
Getting Started With Geo Analysis in SAS® Visual AnalyticsSeeing is believing. Learn the geo analysis capabilities available in SAS Visual Analytics, available out of the box and through Esri integration.
Webinar
Getting Started With Geo Analysis in SAS® Visual AnalyticsSeeing is believing. Learn the geo analysis capabilities available in SAS Visual Analytics, available out of the box and through Esri integration.
-
 เรื่องราวจากลูกค้าของเรา
Travel and tourism forecasts become more accurate with analyticsDER Touristik builds web-based planning tool with SAS to better predict future demand and quickly react to changes in the market.
เรื่องราวจากลูกค้าของเรา
Travel and tourism forecasts become more accurate with analyticsDER Touristik builds web-based planning tool with SAS to better predict future demand and quickly react to changes in the market.
-
 บทความ
From living on the streets to owning a profitable businessZoe Empowers, a ministry for vulnerable children living in life-threatening poverty in Africa and India, finally found a way to measure and reveal its incredible impact. Using SAS, they developed an "empowerment index" that measures improvements in housing, health, education and more for program participants.
บทความ
From living on the streets to owning a profitable businessZoe Empowers, a ministry for vulnerable children living in life-threatening poverty in Africa and India, finally found a way to measure and reveal its incredible impact. Using SAS, they developed an "empowerment index" that measures improvements in housing, health, education and more for program participants.
-
 เรื่องราวจากลูกค้าของเรา
Funding for groundbreaking childhood cancer research fueled by analyticsThe Kids’ Cancer Project uses SAS to improve fundraising efforts for vital cancer research.
เรื่องราวจากลูกค้าของเรา
Funding for groundbreaking childhood cancer research fueled by analyticsThe Kids’ Cancer Project uses SAS to improve fundraising efforts for vital cancer research.
-
 เรื่องราวจากลูกค้าของเรา
A model of institutional research champions the value of analytics for allOklahoma State University uses SAS to create an analytics culture and increase student success.
เรื่องราวจากลูกค้าของเรา
A model of institutional research champions the value of analytics for allOklahoma State University uses SAS to create an analytics culture and increase student success.
-
 เรื่องราวจากลูกค้าของเรา
Predictive analytics and AI deliver a winning fan experience The Orlando Magic uses mobile app data and machine learning to personalize marketing campaigns and analyze game data.
เรื่องราวจากลูกค้าของเรา
Predictive analytics and AI deliver a winning fan experience The Orlando Magic uses mobile app data and machine learning to personalize marketing campaigns and analyze game data.
-
 เรื่องราวจากลูกค้าของเรา
Forecasting accuracy brings ‘new energy’ to CameroonEnergy supplier Eneo balances supply and demand to boost efficiency, save millions and improve reliability with SAS Energy Forecasting.
เรื่องราวจากลูกค้าของเรา
Forecasting accuracy brings ‘new energy’ to CameroonEnergy supplier Eneo balances supply and demand to boost efficiency, save millions and improve reliability with SAS Energy Forecasting.
-
 เรื่องราวจากลูกค้าของเรา
Artificial intelligence and IoT analytics keep aircraft operational for crucial missionsLockheed Martin revolutionizes aircraft maintenance with the SAS Platform.
เรื่องราวจากลูกค้าของเรา
Artificial intelligence and IoT analytics keep aircraft operational for crucial missionsLockheed Martin revolutionizes aircraft maintenance with the SAS Platform.
-
 เรื่องราวจากลูกค้าของเรา
Property experts open analytics to new marketsNVM enhances real estate analytics with SAS Viya open architecture.
เรื่องราวจากลูกค้าของเรา
Property experts open analytics to new marketsNVM enhances real estate analytics with SAS Viya open architecture.
-
 เรื่องราวจากลูกค้าของเรา
Boosting institutional research with data governance and self-service reportingThe University of Idaho invests in SAS to give administrators access to trusted, insight-rich data.
เรื่องราวจากลูกค้าของเรา
Boosting institutional research with data governance and self-service reportingThe University of Idaho invests in SAS to give administrators access to trusted, insight-rich data.
-
 เรื่องราวจากลูกค้าของเรา
Automated laboratories improve uptime with analyticsPredictive service and maintenance keeps Siemens Healthineers lab tests running on time.
เรื่องราวจากลูกค้าของเรา
Automated laboratories improve uptime with analyticsPredictive service and maintenance keeps Siemens Healthineers lab tests running on time.
-
 White Paper
Tar Heels Play to Win With SAS Analytics Learn how Carolina Athletics and its fundraising arm, The Rams Club, use SAS Analytics to deepen existing relationships and broaden a longstanding tradition of loyalty to all 28 of their university sports.
White Paper
Tar Heels Play to Win With SAS Analytics Learn how Carolina Athletics and its fundraising arm, The Rams Club, use SAS Analytics to deepen existing relationships and broaden a longstanding tradition of loyalty to all 28 of their university sports.
-
 เรื่องราวจากลูกค้าของเรา
Self-service analytics advances higher educationThe University of Central Florida depends on analytics and data visualization to uncover insights for increased student success.
เรื่องราวจากลูกค้าของเรา
Self-service analytics advances higher educationThe University of Central Florida depends on analytics and data visualization to uncover insights for increased student success.
-
 เรื่องราวจากลูกค้าของเรา
Smart data exploration advances K-12 public education programsThe South Carolina Department of Education depends on SAS to analyze data and properly fund and serve its school districts.
เรื่องราวจากลูกค้าของเรา
Smart data exploration advances K-12 public education programsThe South Carolina Department of Education depends on SAS to analyze data and properly fund and serve its school districts.
-
 บทความ
Location intelligence: Adding geospatial context to BI Get tips for implementing a location intelligence data strategy from industry thought leader and data explorer, Jen Underwood.
บทความ
Location intelligence: Adding geospatial context to BI Get tips for implementing a location intelligence data strategy from industry thought leader and data explorer, Jen Underwood.
-
 White Paper
The Power of CollaborationThis white paper explains the need for and value of the collaboration and self-service capabilities that SAS Visual Analytics and SAS Office Analytics provide. It provides how-to specifics for incorporating SAS Visual Analytics results with Microsoft Outlook, Excel, PowerPoint, Word and SharePoint with plenty of screen shots, explanations and architecture diagrams for IT.
White Paper
The Power of CollaborationThis white paper explains the need for and value of the collaboration and self-service capabilities that SAS Visual Analytics and SAS Office Analytics provide. It provides how-to specifics for incorporating SAS Visual Analytics results with Microsoft Outlook, Excel, PowerPoint, Word and SharePoint with plenty of screen shots, explanations and architecture diagrams for IT.
-
 Interview
Location analytics: Why adding where makes BI betterLearn how location analytics can enrich your BI endeavors by blending geographic data, spatial analysis and business data for deeper insights.
Interview
Location analytics: Why adding where makes BI betterLearn how location analytics can enrich your BI endeavors by blending geographic data, spatial analysis and business data for deeper insights.
-
 White Paper
Redefine Your Analytics Journey With Interactive Data Exploration and Predictive AnalyticsWhat if your analytics journey were easier? It can be, in five easy steps. Learn how SAS Visual Analytics and SAS Visual Statistics together can provide a fast, fun way to explore data, build models and find the best performer.
White Paper
Redefine Your Analytics Journey With Interactive Data Exploration and Predictive AnalyticsWhat if your analytics journey were easier? It can be, in five easy steps. Learn how SAS Visual Analytics and SAS Visual Statistics together can provide a fast, fun way to explore data, build models and find the best performer.
-
 White Paper
Data Visualization TechniquesA picture is worth a thousand words – especially when you are trying to find relationships and understand your data – which could include thousands or even millions of variables. This paper takes you from the basics of charts and graphs to visualizing big data using SAS Visual Analytics.
White Paper
Data Visualization TechniquesA picture is worth a thousand words – especially when you are trying to find relationships and understand your data – which could include thousands or even millions of variables. This paper takes you from the basics of charts and graphs to visualizing big data using SAS Visual Analytics.
-
 White Paper
Workforce AnalyticsThis paper explores how government HR functions can use advanced analytics, machine learning and AI to develop effective plans to meet hiring, retention and performance goals.
White Paper
Workforce AnalyticsThis paper explores how government HR functions can use advanced analytics, machine learning and AI to develop effective plans to meet hiring, retention and performance goals.
-
 White Paper
TDWI Checklist Report: Gaining Business Value from Governed Analytics and Discoverydata governance
White Paper
TDWI Checklist Report: Gaining Business Value from Governed Analytics and Discoverydata governance
-
 เรื่องราวจากลูกค้าของเรา
University uses analytics to ensure student successWestern Kentucky University uses data visualization and advanced analytics to make informed decisions.
เรื่องราวจากลูกค้าของเรา
University uses analytics to ensure student successWestern Kentucky University uses data visualization and advanced analytics to make informed decisions.
-
 เรื่องราวจากลูกค้าของเรา
Better reporting yields better understanding of risk managementSAS Visual Analytics helps Erste Bank Croatia tackle diverse data for accurate analysis.
เรื่องราวจากลูกค้าของเรา
Better reporting yields better understanding of risk managementSAS Visual Analytics helps Erste Bank Croatia tackle diverse data for accurate analysis.
-
 เรื่องราวจากลูกค้าของเรา
Valencia College uses data-driven approach to improve outcomes in higher educationSAS Visual Analytics empowers administrators to easily manage enrollment, and adjust class availability and resources to help students succeed.
เรื่องราวจากลูกค้าของเรา
Valencia College uses data-driven approach to improve outcomes in higher educationSAS Visual Analytics empowers administrators to easily manage enrollment, and adjust class availability and resources to help students succeed.
-
 White Paper
The Use of Open Source is Growing. So Why Do Organizations Still Turn to SAS?This conclusions paper summarizes a session at the 2014 Hadoop Summit presented by Brian Garrett, Principal Solutions Architect at SAS Institute Inc. titled, “With the Rise of Open Source, Why Organizations Still Turn to SAS.” In it, he explains why corporate analytics requirements are best served when companies run both SAS enterprise-class analytics solutions and open source solutions together. Garrett explains how these technologies meet different needs and co-exist well. He also highlights recent SAS software enhancements that allow analysts to incorporate R algorithms into analytic processes as part of a comprehensive, enterprise-class SAS analytics platform.
White Paper
The Use of Open Source is Growing. So Why Do Organizations Still Turn to SAS?This conclusions paper summarizes a session at the 2014 Hadoop Summit presented by Brian Garrett, Principal Solutions Architect at SAS Institute Inc. titled, “With the Rise of Open Source, Why Organizations Still Turn to SAS.” In it, he explains why corporate analytics requirements are best served when companies run both SAS enterprise-class analytics solutions and open source solutions together. Garrett explains how these technologies meet different needs and co-exist well. He also highlights recent SAS software enhancements that allow analysts to incorporate R algorithms into analytic processes as part of a comprehensive, enterprise-class SAS analytics platform.
-
 บทความ
Is your data too big to visualize?Use these tips to find new ways to look at big data, so you can quickly collapse and condense the results in an intuitive fashion.
บทความ
Is your data too big to visualize?Use these tips to find new ways to look at big data, so you can quickly collapse and condense the results in an intuitive fashion.
-
 บทความ
Why your brain needs data visualizationData visualization software gives you fast answers to your toughest question. In just minutes or seconds. On the fly. Find out how.
บทความ
Why your brain needs data visualizationData visualization software gives you fast answers to your toughest question. In just minutes or seconds. On the fly. Find out how.
-
 White Paper
Fast and FuriousWhite paper for IT that explains the components and deployment options for SAS Visual Analytics.
White Paper
Fast and FuriousWhite paper for IT that explains the components and deployment options for SAS Visual Analytics.
-
 E-Book
Augmented Analytics: The secret ingredient to better business intelligenceAugmented analytics breaks down the limitations of
business intelligence (BI) and brings forward insights
from data using AI and machine learning.
E-Book
Augmented Analytics: The secret ingredient to better business intelligenceAugmented analytics breaks down the limitations of
business intelligence (BI) and brings forward insights
from data using AI and machine learning.
-
 White Paper
Building an Analytical Culture for SuccessAn ambitious, culture-centric project reshaped people’s attitudes about data and quickly returned more than a $1 million in cost savings. See the six guiding principles that led to success where three earlier attempts had failed.
White Paper
Building an Analytical Culture for SuccessAn ambitious, culture-centric project reshaped people’s attitudes about data and quickly returned more than a $1 million in cost savings. See the six guiding principles that led to success where three earlier attempts had failed.
ข้อเสนอที่เกี่ยวข้อง
ตรวจสอบผลิตภัณฑ์และโซลูชั่นที่เกี่ยวข้องกับ SAS Visual Analytics เหล่านี้