
SAS Visual Analytics
Ahora todos pueden descubrir y compartir fácilmente ideas poderosas que inspiran la acción.

Una sola aplicación para informes, exploración de datos y analítica.
-

Vea el panorama general y las conexiones subyacentes.
Detecte rápidamente relaciones importantes en sus datos mediante sugerencias y medidas relacionadas claramente identificadas. Utilice el machine learning y las explicaciones en lenguaje natural para encontrar, visualizar y narrar historias e ideas que sean fáciles de entender y explicar. Descubra porqué sucedió algo, examine todas las opciones y descubra oportunidades ocultas en lo profundo de sus datos. Destaque automáticamente relaciones clave, valores atípicos, grupos y más para revelar información vital que inspire la acción.
-

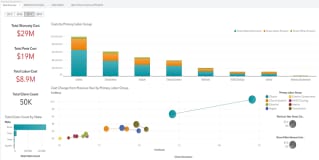
Convierta la vista en comprensión con imágenes dinámicas.
Cree impresionantes informes y paneles interactivos. Resuma rápidamente las métricas clave de rendimiento y compártalas a través de la web y los dispositivos móviles. Los ejecutivos y el personal de primera línea pueden interactuar y colaborar rápidamente con los conocimientos, dividirlos para encontrar sus propias respuestas y comprender mejor el rendimiento del negocio.
-

Obtenga respuestas respaldadas por datos, resultados impulsados por insights.
La analítica predictiva de fácil uso permite que incluso los analistas de negocios evalúen resultados posibles y tomen decisiones más inteligentes basadas en datos – sin que se requiera programación. Algoritmos inteligentes reducen la necesidad de la experimentación manual. Y puede trabajar en colaboración con expertos para enfocarse en lo más relevante.
-

Agregue el 'dónde' al 'qué'.
Agregue contexto geográfico a sus análisis y visualizaciones combinando datos tradicionales con datos de ubicación. El análisis de ubicación trae la dimensión "dónde" al frente para que pueda analizar los datos de nuevas maneras para obtener una imagen completa antes de tomar decisiones mientras identifica oportunidades específicas de la ubicación.
-

Optimice el proceso de descubrimiento.
La preparación de datos de autoservicio brinda a los usuarios comerciales la capacidad de importar sus propios datos, unir tablas, aplicar funciones de calidad de datos, crear columnas calculadas y más, todo con la facilidad de arrastrar y soltar. Al permitir que los usuarios accedan, combinen, limpien y preparen sus propios datos de una manera ágil y confiable, SAS Visual Analytics facilita una adopción más rápida y amplia de análisis para toda su organización.
-

Aproveche lo mejor de ambas plataformas.
Utilice las herramientas de productividad de Microsoft de Microsoft 365 para acceder sin inconvenientes a la analítica de SAS. Profundice en sus datos, acceda e interactúe con informes en SAS Visual Analytics e incorpore información en sus aplicaciones de Microsoft como Excel y Outlook. Luego compártalas con los colaboradores más cercanos.


Características principales
Reportes interactivos. Descubrimiento visual. Analítica de autoservicio. Escalabilidad y gobierno. Todo desde un mismo entorno poderoso en memoria.
Información integrada
Integre insights visuales de forma individual para los reportes de SAS Visual Analytics, cree historias interactivas o incorpore todo el informe o la página interactivos en sus aplicaciones web personalizadas. Publique sus insightsque se escalan con la flexibilidad de los datos en vivo o las instantáneas de datos integrados para la narración de datos.
Aplicaciones SAS Visual Analytics para dispositivos móviles
Use aplicaciones móviles nativas para iOS y Android para ver e interactuar con otros a través de informes y paneles dinámicos en tabletas y teléfonos inteligentes.
Integración abierta para desarrolladores
Agregue visualización creativa con bibliotecas JavaScript de terceros, como D3 y C3, con interactividad total dentro de SAS Visual Analytics. Aproveche los recursos de desarrollo de código abierto para desarrolladores y las API REST para cualquier lenguaje de cliente para acceder a la analítica, datos y servicios de SAS.
Conozca SAS Visual Analytics

Demostraciones interactivas
Consulte estas demos interactivas de SAS Visual Analytics para ver con qué rapidez y facilidad puede explorar y comprender los datos para resolver una variedad de problemas comerciales y de la industria.
-
 PUBLIC HEALTH
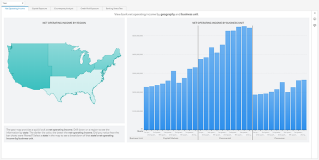
Emerging Disease Surveillance & ForecastingCreate an automated, insightful and transparent surveillance program for use in detecting new disease activity and tracking seasonal diseases.
PUBLIC HEALTH
Emerging Disease Surveillance & ForecastingCreate an automated, insightful and transparent surveillance program for use in detecting new disease activity and tracking seasonal diseases.
-
 Retail y bienes de consumo
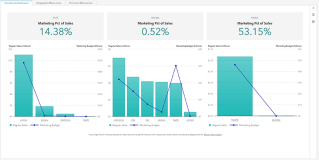
Retail InsightsAnalice el rendimiento de las tiendas regionales y tome decisiones basadas en datos sobre las funciones del retail.
Retail y bienes de consumo
Retail InsightsAnalice el rendimiento de las tiendas regionales y tome decisiones basadas en datos sobre las funciones del retail.
-
 Servicios públicos
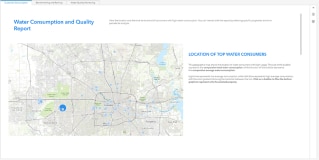
Consumo y calidad del aguaSupervisar la calidad y el consumo de este recurso natural crítico.
Servicios públicos
Consumo y calidad del aguaSupervisar la calidad y el consumo de este recurso natural crítico.
-
 Banca
Banca & Perspectivas de riesgoObtenga una visión holística del riesgo y el rendimiento en todas las regiones, hasta el nivel de la contraparte individual.
Banca
Banca & Perspectivas de riesgoObtenga una visión holística del riesgo y el rendimiento en todas las regiones, hasta el nivel de la contraparte individual.
-
 Manufactura
Análisis de garantíaAnalice las reclamaciones de garantía para identificar rápidamente a los posibles emisores y sus causas subyacentes.
Manufactura
Análisis de garantíaAnalice las reclamaciones de garantía para identificar rápidamente a los posibles emisores y sus causas subyacentes.

SAS Viya es nativo de cloud y agnóstico de cloud
Consume SAS como quieras: SAS gestionado o autogestionado. Y donde quieras.


Explore más sobre SAS Visual Analytics y más allá
Para buscar recursos por tipo, seleccione una opción a continuación.
-
- Seleccione el tipo de recurso
- Artículo
- Caso de estudio
- E-book
- Entrada en el blog
- Entrevista
- ESPECIAL
- Extracto del libro
- HISTORIA DE CLIENTE
- Infografía
- REPORTE DEL ANALISTA
- Series
- video
- Webinar
- White Paper
-
 E-book
Decisions you can trust: A strategic guide to trustworthy data and AI decision makingDiscover how decision intelligence ensures AI agents act with context, ethics and transparency – delivering scalable, auditable and trusted outcomes.
E-book
Decisions you can trust: A strategic guide to trustworthy data and AI decision makingDiscover how decision intelligence ensures AI agents act with context, ethics and transparency – delivering scalable, auditable and trusted outcomes.
-
 E-book
Government navigating an uncertain worldHow governments can harness data,
advanced analytics, and trustworthy AI to
prepare for the unexpected—and respond
faster to protect and improve citizens’ lives.
E-book
Government navigating an uncertain worldHow governments can harness data,
advanced analytics, and trustworthy AI to
prepare for the unexpected—and respond
faster to protect and improve citizens’ lives.
-
 HISTORIA DE CLIENTE
Award-winning bank’s data-driven strategy boosts productivity, efficiency and customer centricityAn ‘analytics for all’ approach helps Banca Intesa Beograd foster informed decision making, innovation and sustainable growth.
HISTORIA DE CLIENTE
Award-winning bank’s data-driven strategy boosts productivity, efficiency and customer centricityAn ‘analytics for all’ approach helps Banca Intesa Beograd foster informed decision making, innovation and sustainable growth.
-
 HISTORIA DE CLIENTE
AI helps students graduate from collegeHillsborough (FL) Community College uses SAS® Visual Analytics to determine what students need to complete their degrees
HISTORIA DE CLIENTE
AI helps students graduate from collegeHillsborough (FL) Community College uses SAS® Visual Analytics to determine what students need to complete their degrees
-
 HISTORIA DE CLIENTE
Jakarta Smart City uses IoT analytics to better serve residentsJakarta and SAS team up to create an award-winning approach to public services and disaster management.
HISTORIA DE CLIENTE
Jakarta Smart City uses IoT analytics to better serve residentsJakarta and SAS team up to create an award-winning approach to public services and disaster management.
-
 HISTORIA DE CLIENTE
Managing Dutch roads and waterways with intelligenceA modern AI, IoT and analytics platform powered by SAS Viya helps Rijkswaterstaat move from reactive to predictive infrastructure maintenance.
HISTORIA DE CLIENTE
Managing Dutch roads and waterways with intelligenceA modern AI, IoT and analytics platform powered by SAS Viya helps Rijkswaterstaat move from reactive to predictive infrastructure maintenance.
-
 HISTORIA DE CLIENTE
Advanced analytics helps policymakers determine how new tax measures would affect citizensAscertaining the ‘winners’ and ‘losers’ of potential tax changes before regulations are implemented.
HISTORIA DE CLIENTE
HISTORIA DE CLIENTE
Advanced analytics helps policymakers determine how new tax measures would affect citizensAscertaining the ‘winners’ and ‘losers’ of potential tax changes before regulations are implemented.
-
 HISTORIA DE CLIENTE
Optimizing cancer patient care with advanced analyticsSAS Viya helps create custom care pathways for Oscar Lambret Center cancer patients.
HISTORIA DE CLIENTE
Optimizing cancer patient care with advanced analyticsSAS Viya helps create custom care pathways for Oscar Lambret Center cancer patients.
-
 HISTORIA DE CLIENTE
Automated safety reporting protects hospital patients in NorwayHelse Nord uses SAS to automate its hospitals’ processes and halves their workload.
HISTORIA DE CLIENTE
Automated safety reporting protects hospital patients in NorwayHelse Nord uses SAS to automate its hospitals’ processes and halves their workload.
-
 HISTORIA DE CLIENTE
Taking the guesswork out of production planningEuramax uses SAS to prevent production delays
HISTORIA DE CLIENTE
Taking the guesswork out of production planningEuramax uses SAS to prevent production delays
-
 HISTORIA DE CLIENTE
Hospitals save time and money with real-time medical device tracking Jan Yperman Hospital uses Blyott and SAS Visual Analytics on SAS Viya to monitor hospital asset locations and ensure optimal purchasing decisions.
HISTORIA DE CLIENTE
Hospitals save time and money with real-time medical device tracking Jan Yperman Hospital uses Blyott and SAS Visual Analytics on SAS Viya to monitor hospital asset locations and ensure optimal purchasing decisions.
-
 HISTORIA DE CLIENTE
One airport operator is making every journey personal for passengersiGA Istanbul Airport creates personalized customer journeys using SAS® MarTech solutions
HISTORIA DE CLIENTE
One airport operator is making every journey personal for passengersiGA Istanbul Airport creates personalized customer journeys using SAS® MarTech solutions
-
 HISTORIA DE CLIENTE
Improving data collection and modeling to accelerate predictive medicine effortsDompé farmaceutici uses SAS for predictive analytics and quantitative disease modeling.
HISTORIA DE CLIENTE
Improving data collection and modeling to accelerate predictive medicine effortsDompé farmaceutici uses SAS for predictive analytics and quantitative disease modeling.
-
 HISTORIA DE CLIENTE
Enhancing road safety with advanced analyticsBelgium’s FPS Justice uses insights from SAS Visual Analytics to crack down on excessive speeding and take more effective action against traffic violators.
HISTORIA DE CLIENTE
Enhancing road safety with advanced analyticsBelgium’s FPS Justice uses insights from SAS Visual Analytics to crack down on excessive speeding and take more effective action against traffic violators.
-
 HISTORIA DE CLIENTE
Ensuring public transparency and one-stop access to crime data and analysisThe North Carolina Criminal Justice Analysis Center uses SAS Viya on SAS Cloud to improve data accessibility and efficiencies in gathering and reporting state and county criminal justice statistics to stakeholders, policymakers and citizens.
HISTORIA DE CLIENTE
Ensuring public transparency and one-stop access to crime data and analysisThe North Carolina Criminal Justice Analysis Center uses SAS Viya on SAS Cloud to improve data accessibility and efficiencies in gathering and reporting state and county criminal justice statistics to stakeholders, policymakers and citizens.
-
 HISTORIA DE CLIENTE
Making prisons and communities safer with data visualizationIowa Department of Corrections uses SAS Viya on SAS Cloud to better manage supervised populations, make informed decisions and improve public safety.
HISTORIA DE CLIENTE
Making prisons and communities safer with data visualizationIowa Department of Corrections uses SAS Viya on SAS Cloud to better manage supervised populations, make informed decisions and improve public safety.
-
 Artículo
Are you good at scoring?Credit scoring is the foundation for evaluating clients who apply for a loan (or other types of exposure for the bank). It is not unusual for it to take up to 12 months to build and deploy a new credit scoring model. Reforming the process will help minimize losses, increase earnings and reduce operational risk.
Artículo
Are you good at scoring?Credit scoring is the foundation for evaluating clients who apply for a loan (or other types of exposure for the bank). It is not unusual for it to take up to 12 months to build and deploy a new credit scoring model. Reforming the process will help minimize losses, increase earnings and reduce operational risk.
-
 HISTORIA DE CLIENTE
One of the largest multi-sport clubs in Portugal aims to win big with analyticsSport Lisboa e Benfica modernizes its operations with SAS Analytics, as it looks to expand internationally.
HISTORIA DE CLIENTE
One of the largest multi-sport clubs in Portugal aims to win big with analyticsSport Lisboa e Benfica modernizes its operations with SAS Analytics, as it looks to expand internationally.
-
 HISTORIA DE CLIENTE
Analytics helps major public health system run efficient programs and improve patient careThe Los Angeles County Department of Health Services relies on advanced analytics from SAS to meet federal regulations, ensure financial viability and better serve a diverse population of more than 10 million people.
HISTORIA DE CLIENTE
Analytics helps major public health system run efficient programs and improve patient careThe Los Angeles County Department of Health Services relies on advanced analytics from SAS to meet federal regulations, ensure financial viability and better serve a diverse population of more than 10 million people.
-
 HISTORIA DE CLIENTE
It’s all in the research: Using AI to solve issues in health careWith the University of Alberta's new health data management and analysis platform, DARC, it can now increase research capacity and provide high-performance computing and data storage in a secure environment. SAS provided the university software to help make its platform thrive amidst a global pandemic.
HISTORIA DE CLIENTE
It’s all in the research: Using AI to solve issues in health careWith the University of Alberta's new health data management and analysis platform, DARC, it can now increase research capacity and provide high-performance computing and data storage in a secure environment. SAS provided the university software to help make its platform thrive amidst a global pandemic.
-
 HISTORIA DE CLIENTE
Analytic models spotlight risky loansItaly’s Ministry of Economy and Finance uses advanced analytics on SAS Viya to quickly calculate risk on financial guarantees.
HISTORIA DE CLIENTE
Analytic models spotlight risky loansItaly’s Ministry of Economy and Finance uses advanced analytics on SAS Viya to quickly calculate risk on financial guarantees.
-
 HISTORIA DE CLIENTE
Italy’s second-largest hospital uses advanced analytics for effective pandemic responseGemelli University Hospital uses SAS solutions to predict admissions of patients in the intensive care units and impacts on the organization, from staffing hospital wards to effectively scheduling and managing COVID-19 vaccine administration.
HISTORIA DE CLIENTE
Italy’s second-largest hospital uses advanced analytics for effective pandemic responseGemelli University Hospital uses SAS solutions to predict admissions of patients in the intensive care units and impacts on the organization, from staffing hospital wards to effectively scheduling and managing COVID-19 vaccine administration.
-
 HISTORIA DE CLIENTE
Finland’s top retail bank applies AI to improve customer service and credit scoringS-Bank provides better customer service and faster, more accurate loan processing time using SAS Viya on Azure.
HISTORIA DE CLIENTE
Finland’s top retail bank applies AI to improve customer service and credit scoringS-Bank provides better customer service and faster, more accurate loan processing time using SAS Viya on Azure.
-
 HISTORIA DE CLIENTE
Real-time analytics helps telecom provider adapt to changing customer needs during global pandemic and beyondTelefónica Ecuador accelerates digital transformation, improves campaigns and achieves growth via intelligent decisioning powered by SAS.
HISTORIA DE CLIENTE
Real-time analytics helps telecom provider adapt to changing customer needs during global pandemic and beyondTelefónica Ecuador accelerates digital transformation, improves campaigns and achieves growth via intelligent decisioning powered by SAS.
-
 HISTORIA DE CLIENTE
Transforming the consumer banking experience through advanced analyticsCIMB Singapore uses SAS Viya to enhance business operations and keep pace with changing customer needs.
HISTORIA DE CLIENTE
Transforming the consumer banking experience through advanced analyticsCIMB Singapore uses SAS Viya to enhance business operations and keep pace with changing customer needs.
-
 HISTORIA DE CLIENTE
Delivery company relies on analytics to optimize logistics and swiftly meet changing marketplace dynamicsRelais Colis reinvents itself during global pandemic using SAS Visual Analytics to ensure continuity of business and quality of service.
HISTORIA DE CLIENTE
Delivery company relies on analytics to optimize logistics and swiftly meet changing marketplace dynamicsRelais Colis reinvents itself during global pandemic using SAS Visual Analytics to ensure continuity of business and quality of service.
-
 HISTORIA DE CLIENTE
Reaching 3.6 million football fans via comprehensive marketing analyticsThe Royal Dutch Football Federation relies on SAS Customer Intelligence 360 to better understand what motivates players and fans, engage audiences with personalized communications, and promote the love of the game.
HISTORIA DE CLIENTE
Reaching 3.6 million football fans via comprehensive marketing analyticsThe Royal Dutch Football Federation relies on SAS Customer Intelligence 360 to better understand what motivates players and fans, engage audiences with personalized communications, and promote the love of the game.
-
 HISTORIA DE CLIENTE
Analytics helps ensure fair and balanced pay structures across Sweden’s public sectorTietoEVRY and SAS partner to help Sweden's largest employer organization, Adda, offer a nationally aggregated salary planning tool for municipalities and regions across the country.
HISTORIA DE CLIENTE
Analytics helps ensure fair and balanced pay structures across Sweden’s public sectorTietoEVRY and SAS partner to help Sweden's largest employer organization, Adda, offer a nationally aggregated salary planning tool for municipalities and regions across the country.
-
 HISTORIA DE CLIENTE
Travel and tourism forecasts become more accurate with analyticsDER Touristik builds web-based planning tool with SAS to better predict future demand and quickly react to changes in the market.
HISTORIA DE CLIENTE
Travel and tourism forecasts become more accurate with analyticsDER Touristik builds web-based planning tool with SAS to better predict future demand and quickly react to changes in the market.
-
 Artículo
From living on the streets to owning a profitable businessZoe Empowers, a ministry for vulnerable children living in life-threatening poverty in Africa and India, finally found a way to measure and reveal its incredible impact. Using SAS, they developed an "empowerment index" that measures improvements in housing, health, education and more for program participants.
Artículo
From living on the streets to owning a profitable businessZoe Empowers, a ministry for vulnerable children living in life-threatening poverty in Africa and India, finally found a way to measure and reveal its incredible impact. Using SAS, they developed an "empowerment index" that measures improvements in housing, health, education and more for program participants.
-
 HISTORIA DE CLIENTE
Funding for groundbreaking childhood cancer research fueled by analyticsThe Kids’ Cancer Project uses SAS to improve fundraising efforts for vital cancer research.
HISTORIA DE CLIENTE
Funding for groundbreaking childhood cancer research fueled by analyticsThe Kids’ Cancer Project uses SAS to improve fundraising efforts for vital cancer research.
-
 HISTORIA DE CLIENTE
A model of institutional research champions the value of analytics for allOklahoma State University uses SAS to create an analytics culture and increase student success.
HISTORIA DE CLIENTE
A model of institutional research champions the value of analytics for allOklahoma State University uses SAS to create an analytics culture and increase student success.
-
 HISTORIA DE CLIENTE
Predictive analytics and AI deliver a winning fan experience The Orlando Magic uses mobile app data and machine learning to personalize marketing campaigns and analyze game data.
HISTORIA DE CLIENTE
Predictive analytics and AI deliver a winning fan experience The Orlando Magic uses mobile app data and machine learning to personalize marketing campaigns and analyze game data.
-
 HISTORIA DE CLIENTE
Forecasting accuracy brings ‘new energy’ to CameroonEnergy supplier Eneo balances supply and demand to boost efficiency, save millions and improve reliability with SAS Energy Forecasting.
HISTORIA DE CLIENTE
Forecasting accuracy brings ‘new energy’ to CameroonEnergy supplier Eneo balances supply and demand to boost efficiency, save millions and improve reliability with SAS Energy Forecasting.
-
 HISTORIA DE CLIENTE
Artificial intelligence and IoT analytics keep aircraft operational for crucial missionsLockheed Martin revolutionizes aircraft maintenance with the SAS Platform.
HISTORIA DE CLIENTE
Artificial intelligence and IoT analytics keep aircraft operational for crucial missionsLockheed Martin revolutionizes aircraft maintenance with the SAS Platform.
-
 HISTORIA DE CLIENTE
Property experts open analytics to new marketsNVM enhances real estate analytics with SAS Viya open architecture.
HISTORIA DE CLIENTE
Property experts open analytics to new marketsNVM enhances real estate analytics with SAS Viya open architecture.
-
 HISTORIA DE CLIENTE
Boosting institutional research with data governance and self-service reportingThe University of Idaho invests in SAS to give administrators access to trusted, insight-rich data.
HISTORIA DE CLIENTE
Boosting institutional research with data governance and self-service reportingThe University of Idaho invests in SAS to give administrators access to trusted, insight-rich data.
-
 HISTORIA DE CLIENTE
Automated laboratories improve uptime with analyticsPredictive service and maintenance keeps Siemens Healthineers lab tests running on time.
HISTORIA DE CLIENTE
Automated laboratories improve uptime with analyticsPredictive service and maintenance keeps Siemens Healthineers lab tests running on time.
-
 White Paper
Tar Heels Play to Win With SAS Analytics Learn how Carolina Athletics and its fundraising arm, The Rams Club, use SAS Analytics to deepen existing relationships and broaden a longstanding tradition of loyalty to all 28 of their university sports.
White Paper
Tar Heels Play to Win With SAS Analytics Learn how Carolina Athletics and its fundraising arm, The Rams Club, use SAS Analytics to deepen existing relationships and broaden a longstanding tradition of loyalty to all 28 of their university sports.
-
 HISTORIA DE CLIENTE
Self-service analytics advances higher educationThe University of Central Florida depends on analytics and data visualization to uncover insights for increased student success.
HISTORIA DE CLIENTE
Self-service analytics advances higher educationThe University of Central Florida depends on analytics and data visualization to uncover insights for increased student success.
-
 HISTORIA DE CLIENTE
Smart data exploration advances K-12 public education programsThe South Carolina Department of Education depends on SAS to analyze data and properly fund and serve its school districts.
HISTORIA DE CLIENTE
Smart data exploration advances K-12 public education programsThe South Carolina Department of Education depends on SAS to analyze data and properly fund and serve its school districts.
-
 Artículo
Location intelligence: Adding geospatial context to BI Get tips for implementing a location intelligence data strategy from industry thought leader and data explorer, Jen Underwood.
Artículo
Location intelligence: Adding geospatial context to BI Get tips for implementing a location intelligence data strategy from industry thought leader and data explorer, Jen Underwood.
-
 White Paper
The Power of CollaborationThis white paper explains the need for and value of the collaboration and self-service capabilities that SAS Visual Analytics and SAS Office Analytics provide. It provides how-to specifics for incorporating SAS Visual Analytics results with Microsoft Outlook, Excel, PowerPoint, Word and SharePoint with plenty of screen shots, explanations and architecture diagrams for IT.
White Paper
The Power of CollaborationThis white paper explains the need for and value of the collaboration and self-service capabilities that SAS Visual Analytics and SAS Office Analytics provide. It provides how-to specifics for incorporating SAS Visual Analytics results with Microsoft Outlook, Excel, PowerPoint, Word and SharePoint with plenty of screen shots, explanations and architecture diagrams for IT.
-
 Entrevista
Location analytics: Why adding where makes BI betterLearn how location analytics can enrich your BI endeavors by blending geographic data, spatial analysis and business data for deeper insights.
Entrevista
Location analytics: Why adding where makes BI betterLearn how location analytics can enrich your BI endeavors by blending geographic data, spatial analysis and business data for deeper insights.
-
 White Paper
Redefine Your Analytics Journey With Interactive Data Exploration and Predictive AnalyticsWhat if your analytics journey were easier? It can be, in five easy steps. Learn how SAS Visual Analytics and SAS Visual Statistics together can provide a fast, fun way to explore data, build models and find the best performer.
White Paper
Redefine Your Analytics Journey With Interactive Data Exploration and Predictive AnalyticsWhat if your analytics journey were easier? It can be, in five easy steps. Learn how SAS Visual Analytics and SAS Visual Statistics together can provide a fast, fun way to explore data, build models and find the best performer.
-
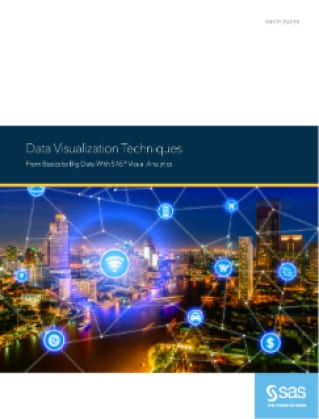 White Paper
Data Visualization TechniquesA picture is worth a thousand words – especially when you are trying to find relationships and understand your data – which could include thousands or even millions of variables. This paper takes you from the basics of charts and graphs to visualizing big data using SAS Visual Analytics.
White Paper
Data Visualization TechniquesA picture is worth a thousand words – especially when you are trying to find relationships and understand your data – which could include thousands or even millions of variables. This paper takes you from the basics of charts and graphs to visualizing big data using SAS Visual Analytics.
-
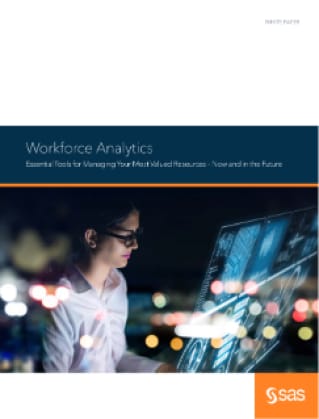 White Paper
Workforce AnalyticsThis paper explores how government HR functions can use advanced analytics, machine learning and AI to develop effective plans to meet hiring, retention and performance goals.
White Paper
Workforce AnalyticsThis paper explores how government HR functions can use advanced analytics, machine learning and AI to develop effective plans to meet hiring, retention and performance goals.
-
 White Paper
TDWI Checklist Report: Gaining Business Value from Governed Analytics and Discoverydata governance
White Paper
TDWI Checklist Report: Gaining Business Value from Governed Analytics and Discoverydata governance
-
 HISTORIA DE CLIENTE
University uses analytics to ensure student successWestern Kentucky University uses data visualization and advanced analytics to make informed decisions.
HISTORIA DE CLIENTE
University uses analytics to ensure student successWestern Kentucky University uses data visualization and advanced analytics to make informed decisions.
-
 HISTORIA DE CLIENTE
Better reporting yields better understanding of risk managementSAS Visual Analytics helps Erste Bank Croatia tackle diverse data for accurate analysis.
HISTORIA DE CLIENTE
Better reporting yields better understanding of risk managementSAS Visual Analytics helps Erste Bank Croatia tackle diverse data for accurate analysis.
-
 HISTORIA DE CLIENTE
Valencia College uses data-driven approach to improve outcomes in higher educationSAS Visual Analytics empowers administrators to easily manage enrollment, and adjust class availability and resources to help students succeed.
HISTORIA DE CLIENTE
Valencia College uses data-driven approach to improve outcomes in higher educationSAS Visual Analytics empowers administrators to easily manage enrollment, and adjust class availability and resources to help students succeed.
-
 White Paper
The Use of Open Source is Growing. So Why Do Organizations Still Turn to SAS?This conclusions paper summarizes a session at the 2014 Hadoop Summit presented by Brian Garrett, Principal Solutions Architect at SAS Institute Inc. titled, “With the Rise of Open Source, Why Organizations Still Turn to SAS.” In it, he explains why corporate analytics requirements are best served when companies run both SAS enterprise-class analytics solutions and open source solutions together. Garrett explains how these technologies meet different needs and co-exist well. He also highlights recent SAS software enhancements that allow analysts to incorporate R algorithms into analytic processes as part of a comprehensive, enterprise-class SAS analytics platform.
White Paper
The Use of Open Source is Growing. So Why Do Organizations Still Turn to SAS?This conclusions paper summarizes a session at the 2014 Hadoop Summit presented by Brian Garrett, Principal Solutions Architect at SAS Institute Inc. titled, “With the Rise of Open Source, Why Organizations Still Turn to SAS.” In it, he explains why corporate analytics requirements are best served when companies run both SAS enterprise-class analytics solutions and open source solutions together. Garrett explains how these technologies meet different needs and co-exist well. He also highlights recent SAS software enhancements that allow analysts to incorporate R algorithms into analytic processes as part of a comprehensive, enterprise-class SAS analytics platform.
-
 Artículo
Is your data too big to visualize?Use these tips to find new ways to look at big data, so you can quickly collapse and condense the results in an intuitive fashion.
Artículo
Is your data too big to visualize?Use these tips to find new ways to look at big data, so you can quickly collapse and condense the results in an intuitive fashion.
-
 White Paper
Fast and FuriousWhite paper for IT that explains the components and deployment options for SAS Visual Analytics.
White Paper
Fast and FuriousWhite paper for IT that explains the components and deployment options for SAS Visual Analytics.
-
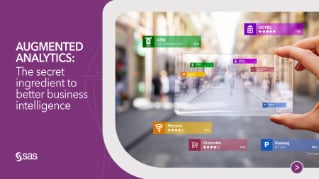 E-book
Augmented Analytics: The secret ingredient to better business intelligenceAugmented analytics breaks down the limitations of
business intelligence (BI) and brings forward insights
from data using AI and machine learning.
E-book
Augmented Analytics: The secret ingredient to better business intelligenceAugmented analytics breaks down the limitations of
business intelligence (BI) and brings forward insights
from data using AI and machine learning.
-
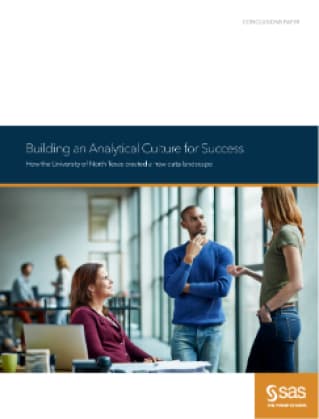 White Paper
Building an Analytical Culture for SuccessAn ambitious, culture-centric project reshaped people’s attitudes about data and quickly returned more than a $1 million in cost savings. See the six guiding principles that led to success where three earlier attempts had failed.
White Paper
Building an Analytical Culture for SuccessAn ambitious, culture-centric project reshaped people’s attitudes about data and quickly returned more than a $1 million in cost savings. See the six guiding principles that led to success where three earlier attempts had failed.

Productos relacionados
Consulte estos productos y soluciones relacionados con SAS Visual Analytics.