
SAS Visual Analytics
Now everyone can easily discover and share powerful insights that inspire action.

A single application for reporting, data exploration and analytics
-

See the big picture – and underlying connections
Quickly spot important relationships in your data using suggestions and clearly identified related measures. Use machine learning and natural language explanations to find, visualize and narrate stories and insights that are easy to understand and explain. Find out why something happened, examine all options and uncover opportunities hidden deep in your data. Automatically highlight key relationships, outliers, clusters and more to reveal vital insights that inspire action.
-

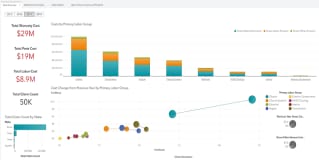
Turn seeing into understanding with dynamic visuals
Create stunning interactive reports and dashboards. Quickly summarize key performance metrics and share them via the web and mobile devices. Executives and front-line staff can quickly interact with and collaborate on insights, slice and dice them to find their own answers, and better understand business performance.
-

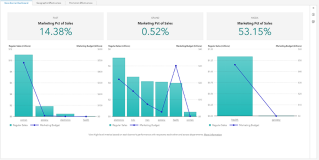
Get answers backed by data, results driven by insight
Easy-to-use predictive analytics enables even business analysts to assess possible outcomes and make smarter, data-driven decisions – no programming required. Smart algorithms reduce the need for manual experimentation. And you can work collaboratively with experts to focus on what’s most relevant.
-

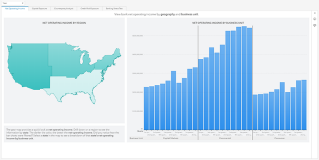
Add the 'where' to the 'what'
Add geographical context to your analyses and visualizations by combining traditional data with location data. Location analysis brings the “where” dimension to the forefront so you can analyze data in new ways to get the full picture before making decisions while identifying location-specific opportunities.
-

Streamline the discovery process
Self-service data preparation gives business users the ability to import their own data, join tables, apply data quality functions, create calculated columns and more – all with drag-and-drop ease. By empowering users to access, combine, clean and prepare their own data in an agile – and trusted – way, SAS Visual Analytics facilitates faster, broader adoption of analytics for your entire organization.
-

Leverage the best of both platforms
Use Microsoft productivity tools from Microsoft 365 for seamless access to analytics from SAS. Drill down into your data, access and interact with reports in SAS Visual Analytics and embed insights in your Microsoft applications like Excel and Outlook. Then share them with your closest collaborators.


Key Features
Interactive reporting. Visual discovery. Self-service analytics. Scalability and governance. All from a single, powerful in-memory environment.
Embedded insights
Embed individual visual insights from SAS Visual Analytics reports, build interactive stories or embed the whole interactive report or page into your custom web applications. Publish your insights that scale with the flexibility of live data or embedded data snapshots for data storytelling.
SAS Visual Analytics Apps for mobile devices
Use native mobile apps for iOS and Android to view and interact with others through dynamic reports and dashboards on tablets and smartphones.
Open integration for developers
Add creative visualization with third-party JavaScript libraries, such as D3 and C3, with full interactivity within SAS Visual Analytics. Leverage open source development resources for developers and REST APIs for any client language to access SAS analytics, data and services.
Get to Know SAS Visual Analytics

Interactive Demos
Check out these SAS Visual Analytics interactive demos to see how quickly and easily you can explore and understand data to resolve a variety of industry and business issues.
-
 BANKING
Banking & Risk InsightsGet a holistic view of risk and performance across regions, down to the individual counterparty level.
BANKING
Banking & Risk InsightsGet a holistic view of risk and performance across regions, down to the individual counterparty level.
-
 RETAIL & CONSUMER GOODS
Retail InsightsAnalyze regional store performance, and make data-driven decisions about retail business functions.
RETAIL & CONSUMER GOODS
Retail InsightsAnalyze regional store performance, and make data-driven decisions about retail business functions.
-
 MANUFACTURING
Warranty AnalysisAnalyze warranty claims to quickly identify potential issues and their underlying causes.
MANUFACTURING
Warranty AnalysisAnalyze warranty claims to quickly identify potential issues and their underlying causes.
-
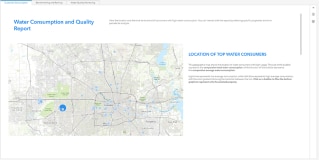 UTILITIES
Water Consumption & QualityMonitor the quality and consumption of this critical natural resource.
UTILITIES
Water Consumption & QualityMonitor the quality and consumption of this critical natural resource.
-
 PUBLIC HEALTH
Emerging Disease Surveillance & ForecastingCreate an automated, insightful and transparent surveillance program for use in detecting new disease activity and tracking seasonal diseases.
PUBLIC HEALTH
Emerging Disease Surveillance & ForecastingCreate an automated, insightful and transparent surveillance program for use in detecting new disease activity and tracking seasonal diseases.

SAS Viya is cloud-native and cloud-agnostic
Consume SAS how you want – SAS managed or self-managed. And where you want.


Explore More on SAS Visual Analytics and Beyond
To browse resources by type, select an option below.
-
- Select Resource Type
- Analyst Report
- Article
- Blog Post
- Book Excerpt
- Case Study
- Customer Story
- E-Book
- Infographic
- Interview
- Research
- Series
- Video
- Webinar
- White Paper
-
 Customer Story
Modernization initiative set to improve taxpayer compliance and moraleThe Malta Tax and Customs Administration automatically detects compliance discrepancies and filing errors with SAS Viya.
Customer Story
Modernization initiative set to improve taxpayer compliance and moraleThe Malta Tax and Customs Administration automatically detects compliance discrepancies and filing errors with SAS Viya.
-
 Customer Story
Jakarta Smart City uses IoT analytics to better serve residentsJakarta and SAS team up to create an award-winning approach to public services and disaster management.
Customer Story
Jakarta Smart City uses IoT analytics to better serve residentsJakarta and SAS team up to create an award-winning approach to public services and disaster management.
-
 Customer Story
Breaking the cycle of poverty through advanced analyticsCompassion International uses advanced analytics to help millions of children from impoverished nations secure food, medical care and educational resources to grow, learn and thrive.
Customer Story
Breaking the cycle of poverty through advanced analyticsCompassion International uses advanced analytics to help millions of children from impoverished nations secure food, medical care and educational resources to grow, learn and thrive.
-
 Customer Story
Managing Dutch roads and waterways with intelligenceA modern AI, IoT and analytics platform powered by SAS Viya helps Rijkswaterstaat move from reactive to predictive infrastructure maintenance.
Customer Story
Managing Dutch roads and waterways with intelligenceA modern AI, IoT and analytics platform powered by SAS Viya helps Rijkswaterstaat move from reactive to predictive infrastructure maintenance.
-
 Customer Story
 & Video
Advanced analytics helps policymakers determine how new tax measures would affect citizensAscertaining the ‘winners’ and ‘losers’ of potential tax changes before regulations are implemented.
Customer Story
Customer Story & Video
Advanced analytics helps policymakers determine how new tax measures would affect citizensAscertaining the ‘winners’ and ‘losers’ of potential tax changes before regulations are implemented.
-
 Customer Story
Optimizing cancer patient care with advanced analyticsSAS Viya helps create custom care pathways for Oscar Lambret Center cancer patients.
Customer Story
Optimizing cancer patient care with advanced analyticsSAS Viya helps create custom care pathways for Oscar Lambret Center cancer patients.
-
 Customer Story
Automated safety reporting protects hospital patients in NorwayHelse Nord uses SAS to automate its hospitals’ processes and halves their workload.
Customer Story
Automated safety reporting protects hospital patients in NorwayHelse Nord uses SAS to automate its hospitals’ processes and halves their workload.
-
 Customer Story
Taking the guesswork out of production planningEuramax uses SAS to prevent production delays
Customer Story
Taking the guesswork out of production planningEuramax uses SAS to prevent production delays
-
 Customer Story
Hospitals save time and money with real-time medical device tracking Jan Yperman Hospital uses Blyott and SAS Visual Analytics on SAS Viya to monitor hospital asset locations and ensure optimal purchasing decisions.
Customer Story
Hospitals save time and money with real-time medical device tracking Jan Yperman Hospital uses Blyott and SAS Visual Analytics on SAS Viya to monitor hospital asset locations and ensure optimal purchasing decisions.
-
 Customer Story
One airport operator is making every journey personal for passengersiGA Istanbul Airport creates personalized customer journeys using SAS® MarTech solutions
Customer Story
One airport operator is making every journey personal for passengersiGA Istanbul Airport creates personalized customer journeys using SAS® MarTech solutions
-
 Customer Story
Improving data collection and modeling to accelerate predictive medicine effortsDompé farmaceutici uses SAS for predictive analytics and quantitative disease modeling.
Customer Story
Improving data collection and modeling to accelerate predictive medicine effortsDompé farmaceutici uses SAS for predictive analytics and quantitative disease modeling.
-
 Customer Story
Enhancing road safety with advanced analyticsBelgium’s FPS Justice uses insights from SAS Visual Analytics to crack down on excessive speeding and take more effective action against traffic violators.
Customer Story
Enhancing road safety with advanced analyticsBelgium’s FPS Justice uses insights from SAS Visual Analytics to crack down on excessive speeding and take more effective action against traffic violators.
-
 Customer Story
Ensuring public transparency and one-stop access to crime data and analysisThe North Carolina Criminal Justice Analysis Center uses SAS Viya on SAS Cloud to improve data accessibility and efficiencies in gathering and reporting state and county criminal justice statistics to stakeholders, policymakers and citizens.
Customer Story
Ensuring public transparency and one-stop access to crime data and analysisThe North Carolina Criminal Justice Analysis Center uses SAS Viya on SAS Cloud to improve data accessibility and efficiencies in gathering and reporting state and county criminal justice statistics to stakeholders, policymakers and citizens.
-
 Customer Story
Making prisons and communities safer with data visualizationIowa Department of Corrections uses SAS Viya on SAS Cloud to better manage supervised populations, make informed decisions and improve public safety.
Customer Story
Making prisons and communities safer with data visualizationIowa Department of Corrections uses SAS Viya on SAS Cloud to better manage supervised populations, make informed decisions and improve public safety.
-
 Article
Are you good at scoring?Credit scoring is the foundation for evaluating clients who apply for a loan (or other types of exposure for the bank). It is not unusual for it to take up to 12 months to build and deploy a new credit scoring model. Reforming the process will help minimize losses, increase earnings and reduce operational risk.
Article
Are you good at scoring?Credit scoring is the foundation for evaluating clients who apply for a loan (or other types of exposure for the bank). It is not unusual for it to take up to 12 months to build and deploy a new credit scoring model. Reforming the process will help minimize losses, increase earnings and reduce operational risk.
-
 Customer Story
One of the largest multi-sport clubs in Portugal aims to win big with analyticsSport Lisboa e Benfica modernizes its operations with SAS Analytics, as it looks to expand internationally.
Customer Story
One of the largest multi-sport clubs in Portugal aims to win big with analyticsSport Lisboa e Benfica modernizes its operations with SAS Analytics, as it looks to expand internationally.
-
 Customer Story
Norway’s largest telecommunications, media and technology provider adapts to rapidly changing customer expectations using a hybrid cloud approachTelenor relies on SAS Viya on Azure and SAS Customer Intelligence 360 to provide fast, personalized customer service based on real-time analytics.
Customer Story
Norway’s largest telecommunications, media and technology provider adapts to rapidly changing customer expectations using a hybrid cloud approachTelenor relies on SAS Viya on Azure and SAS Customer Intelligence 360 to provide fast, personalized customer service based on real-time analytics.
-
 Customer Story
Analytics helps major public health system run efficient programs and improve patient careThe Los Angeles County Department of Health Services relies on advanced analytics from SAS to meet federal regulations, ensure financial viability and better serve a diverse population of more than 10 million people.
Customer Story
Analytics helps major public health system run efficient programs and improve patient careThe Los Angeles County Department of Health Services relies on advanced analytics from SAS to meet federal regulations, ensure financial viability and better serve a diverse population of more than 10 million people.
-
 Customer Story
It’s all in the research: Using AI to solve issues in health careWith the University of Alberta's new health data management and analysis platform, DARC, it can now increase research capacity and provide high-performance computing and data storage in a secure environment. SAS provided the university software to help make its platform thrive amidst a global pandemic.
Customer Story
It’s all in the research: Using AI to solve issues in health careWith the University of Alberta's new health data management and analysis platform, DARC, it can now increase research capacity and provide high-performance computing and data storage in a secure environment. SAS provided the university software to help make its platform thrive amidst a global pandemic.
-
 Customer Story
Analytic models spotlight risky loansItaly’s Ministry of Economy and Finance uses advanced analytics on SAS Viya to quickly calculate risk on financial guarantees.
Customer Story
Analytic models spotlight risky loansItaly’s Ministry of Economy and Finance uses advanced analytics on SAS Viya to quickly calculate risk on financial guarantees.
-
 Customer Story
Italy’s second-largest hospital uses advanced analytics for effective pandemic responseGemelli University Hospital uses SAS solutions to predict admissions of patients in the intensive care units and impacts on the organization, from staffing hospital wards to effectively scheduling and managing COVID-19 vaccine administration.
Customer Story
Italy’s second-largest hospital uses advanced analytics for effective pandemic responseGemelli University Hospital uses SAS solutions to predict admissions of patients in the intensive care units and impacts on the organization, from staffing hospital wards to effectively scheduling and managing COVID-19 vaccine administration.
-
 Customer Story
Finland’s top retail bank applies AI to improve customer service and credit scoringS-Bank provides better customer service and faster, more accurate loan processing time using SAS Viya on Azure.
Customer Story
Finland’s top retail bank applies AI to improve customer service and credit scoringS-Bank provides better customer service and faster, more accurate loan processing time using SAS Viya on Azure.
-
 Customer Story
Real-time analytics helps telecom provider adapt to changing customer needs during global pandemic and beyondTelefónica Ecuador accelerates digital transformation, improves campaigns and achieves growth via intelligent decisioning powered by SAS.
Customer Story
Real-time analytics helps telecom provider adapt to changing customer needs during global pandemic and beyondTelefónica Ecuador accelerates digital transformation, improves campaigns and achieves growth via intelligent decisioning powered by SAS.
-
 Customer Story
Transforming the consumer banking experience through advanced analyticsCIMB Singapore uses SAS Viya to enhance business operations and keep pace with changing customer needs.
Customer Story
Transforming the consumer banking experience through advanced analyticsCIMB Singapore uses SAS Viya to enhance business operations and keep pace with changing customer needs.
-
 Customer Story
Delivery company relies on analytics to optimize logistics and swiftly meet changing marketplace dynamicsRelais Colis reinvents itself during global pandemic using SAS Visual Analytics to ensure continuity of business and quality of service.
Customer Story
Delivery company relies on analytics to optimize logistics and swiftly meet changing marketplace dynamicsRelais Colis reinvents itself during global pandemic using SAS Visual Analytics to ensure continuity of business and quality of service.
-
 Customer Story
Reaching 3.6 million football fans via comprehensive marketing analyticsThe Royal Dutch Football Federation relies on SAS Customer Intelligence 360 to better understand what motivates players and fans, engage audiences with personalized communications, and promote the love of the game.
Customer Story
Reaching 3.6 million football fans via comprehensive marketing analyticsThe Royal Dutch Football Federation relies on SAS Customer Intelligence 360 to better understand what motivates players and fans, engage audiences with personalized communications, and promote the love of the game.
-
 Customer Story
Analytics helps ensure fair and balanced pay structures across Sweden’s public sectorTietoEVRY and SAS partner to help Sweden's largest employer organization, Adda, offer a nationally aggregated salary planning tool for municipalities and regions across the country.
Customer Story
Analytics helps ensure fair and balanced pay structures across Sweden’s public sectorTietoEVRY and SAS partner to help Sweden's largest employer organization, Adda, offer a nationally aggregated salary planning tool for municipalities and regions across the country.
-
 Analyst Report
Gartner positions SAS as a Leader in the Magic Quadrant for Data Science and Machine Learning Platforms, Q1 2021Gartner positions SAS as a Leader in the Magic Quadrant for Data Science and Machine Learning Platforms for the eighth consecutive year.
Analyst Report
Gartner positions SAS as a Leader in the Magic Quadrant for Data Science and Machine Learning Platforms, Q1 2021Gartner positions SAS as a Leader in the Magic Quadrant for Data Science and Machine Learning Platforms for the eighth consecutive year.
-
 Webinar
Getting Started With Geo Analysis in SAS® Visual AnalyticsSeeing is believing. Learn the geo analysis capabilities available in SAS Visual Analytics, available out of the box and through Esri integration.
Webinar
Getting Started With Geo Analysis in SAS® Visual AnalyticsSeeing is believing. Learn the geo analysis capabilities available in SAS Visual Analytics, available out of the box and through Esri integration.
-
 Customer Story
Travel and tourism forecasts become more accurate with analyticsDER Touristik builds web-based planning tool with SAS to better predict future demand and quickly react to changes in the market.
Customer Story
Travel and tourism forecasts become more accurate with analyticsDER Touristik builds web-based planning tool with SAS to better predict future demand and quickly react to changes in the market.
-
 Customer Story
A data-driven approach to whole person careRiverside County relies on data integration and analytics from SAS to improve the health and well-being of vulnerable Californians.
Customer Story
A data-driven approach to whole person careRiverside County relies on data integration and analytics from SAS to improve the health and well-being of vulnerable Californians.
-
 Article
From living on the streets to owning a profitable businessZoe Empowers, a ministry for vulnerable children living in life-threatening poverty in Africa and India, finally found a way to measure and reveal its incredible impact. Using SAS, they developed an "empowerment index" that measures improvements in housing, health, education and more for program participants.
Article
From living on the streets to owning a profitable businessZoe Empowers, a ministry for vulnerable children living in life-threatening poverty in Africa and India, finally found a way to measure and reveal its incredible impact. Using SAS, they developed an "empowerment index" that measures improvements in housing, health, education and more for program participants.
-
 Customer Story
Prison violence dramatically drops with analytics-based risk assessmentThe Indiana Department of Correction uses real-time data and predictive analytics from SAS to reduce violent attacks on staff by 50%.
Customer Story
Prison violence dramatically drops with analytics-based risk assessmentThe Indiana Department of Correction uses real-time data and predictive analytics from SAS to reduce violent attacks on staff by 50%.
-
 Customer Story
Funding for ground-breaking childhood cancer research fueled by analyticsThe Kids’ Cancer Project uses SAS to improve fundraising efforts for vital cancer research.
Customer Story
Funding for ground-breaking childhood cancer research fueled by analyticsThe Kids’ Cancer Project uses SAS to improve fundraising efforts for vital cancer research.
-
 Customer Story
A model of institutional research champions the value of analytics for allOklahoma State University uses SAS to create an analytics culture and increase student success.
Customer Story
A model of institutional research champions the value of analytics for allOklahoma State University uses SAS to create an analytics culture and increase student success.
-
 Customer Story
Predictive analytics and AI deliver a winning fan experience The Orlando Magic uses mobile app data and machine learning to personalize marketing campaigns and analyze game data.
Customer Story
Predictive analytics and AI deliver a winning fan experience The Orlando Magic uses mobile app data and machine learning to personalize marketing campaigns and analyze game data.
-
 Customer Story
Forecasting accuracy brings ‘new energy’ to CameroonEnergy supplier Eneo balances supply and demand to boost efficiency, save millions and improve reliability with SAS Energy Forecasting.
Customer Story
Forecasting accuracy brings ‘new energy’ to CameroonEnergy supplier Eneo balances supply and demand to boost efficiency, save millions and improve reliability with SAS Energy Forecasting.
-
 Customer Story
Artificial intelligence and IoT analytics keep aircraft operational for crucial missionsLockheed Martin revolutionizes aircraft maintenance with the SAS Platform.
Customer Story
Artificial intelligence and IoT analytics keep aircraft operational for crucial missionsLockheed Martin revolutionizes aircraft maintenance with the SAS Platform.
-
 Customer Story
Property experts open analytics to new marketsNVM enhances real estate analytics with SAS Viya open architecture.
Customer Story
Property experts open analytics to new marketsNVM enhances real estate analytics with SAS Viya open architecture.
-
 Customer Story
Boosting institutional research with data governance and self-service reportingThe University of Idaho invests in SAS to give administrators access to trusted, insight-rich data.
Customer Story
Boosting institutional research with data governance and self-service reportingThe University of Idaho invests in SAS to give administrators access to trusted, insight-rich data.
-
 Customer Story
Next-day deliveries in hand with analyticsParcel delivery company Relais Colis adapts to online shopping revolution by using SAS Visual Analytics to automate reporting, shorten delivery times.
Customer Story
Next-day deliveries in hand with analyticsParcel delivery company Relais Colis adapts to online shopping revolution by using SAS Visual Analytics to automate reporting, shorten delivery times.
-
 Customer Story
Automated laboratories improve uptime with analyticsPredictive service and maintenance keeps Siemens Healthineers lab tests running on time.
Customer Story
Automated laboratories improve uptime with analyticsPredictive service and maintenance keeps Siemens Healthineers lab tests running on time.
-
 Customer Story
Make faster, better lending decisions
Customer Story
Make faster, better lending decisions -
 Customer Story
Leveraging analytics to streamline and improve company-wide reportingSAS® Visual Analytics offers KEI Industries the freedom to access their data anytime and anywhere
Customer Story
Leveraging analytics to streamline and improve company-wide reportingSAS® Visual Analytics offers KEI Industries the freedom to access their data anytime and anywhere
-
 White Paper
Tar Heels Play to Win With SAS Analytics Learn how Carolina Athletics and its fundraising arm, The Rams Club, use SAS Analytics to deepen existing relationships and broaden a longstanding tradition of loyalty to all 28 of their university sports.
White Paper
Tar Heels Play to Win With SAS Analytics Learn how Carolina Athletics and its fundraising arm, The Rams Club, use SAS Analytics to deepen existing relationships and broaden a longstanding tradition of loyalty to all 28 of their university sports.
-
 Case Study
Visualizing data makes approachable analytics much easier Visualizing data makes approachable analytics much easier
Case Study
Visualizing data makes approachable analytics much easier Visualizing data makes approachable analytics much easier
-
 Customer Story
Self-service analytics advances higher educationThe University of Central Florida depends on analytics and data visualization to uncover insights for increased student success.
Customer Story
Self-service analytics advances higher educationThe University of Central Florida depends on analytics and data visualization to uncover insights for increased student success.
-
 Customer Story
Smart data exploration advances K-12 public education programsThe South Carolina Department of Education depends on SAS to analyze data and properly fund and serve its school districts.
Customer Story
Smart data exploration advances K-12 public education programsThe South Carolina Department of Education depends on SAS to analyze data and properly fund and serve its school districts.
-
 Article
Location intelligence: Adding geospatial context to BI Get tips for implementing a location intelligence data strategy from industry thought leader and data explorer, Jen Underwood.
Article
Location intelligence: Adding geospatial context to BI Get tips for implementing a location intelligence data strategy from industry thought leader and data explorer, Jen Underwood.
-
 Customer Story
Achieving academic and operational excellence through business intelligenceCurtin University uses SAS Visual Analytics to provide reporting across the organization.
Customer Story
Achieving academic and operational excellence through business intelligenceCurtin University uses SAS Visual Analytics to provide reporting across the organization.
-
 White Paper
The Power of CollaborationThis white paper explains the need for and value of the collaboration and self-service capabilities that SAS Visual Analytics and SAS Office Analytics provide. It provides how-to specifics for incorporating SAS Visual Analytics results with Microsoft Outlook, Excel, PowerPoint, Word and SharePoint with plenty of screen shots, explanations and architecture diagrams for IT.
White Paper
The Power of CollaborationThis white paper explains the need for and value of the collaboration and self-service capabilities that SAS Visual Analytics and SAS Office Analytics provide. It provides how-to specifics for incorporating SAS Visual Analytics results with Microsoft Outlook, Excel, PowerPoint, Word and SharePoint with plenty of screen shots, explanations and architecture diagrams for IT.
-
 Interview
Location analytics: Why adding where makes BI betterLearn how location analytics can enrich your BI endeavors by blending geographic data, spatial analysis and business data for deeper insights.
Interview
Location analytics: Why adding where makes BI betterLearn how location analytics can enrich your BI endeavors by blending geographic data, spatial analysis and business data for deeper insights.
-
 White Paper
Redefine Your Analytics Journey With Interactive Data Exploration and Predictive AnalyticsWhat if your analytics journey were easier? It can be, in five easy steps. Learn how SAS Visual Analytics and SAS Visual Statistics together can provide a fast, fun way to explore data, build models and find the best performer.
White Paper
Redefine Your Analytics Journey With Interactive Data Exploration and Predictive AnalyticsWhat if your analytics journey were easier? It can be, in five easy steps. Learn how SAS Visual Analytics and SAS Visual Statistics together can provide a fast, fun way to explore data, build models and find the best performer.
-
 White Paper
Data Visualization TechniquesA picture is worth a thousand words – especially when you are trying to find relationships and understand your data – which could include thousands or even millions of variables. This paper takes you from the basics of charts and graphs to visualizing big data using SAS Visual Analytics.
White Paper
Data Visualization TechniquesA picture is worth a thousand words – especially when you are trying to find relationships and understand your data – which could include thousands or even millions of variables. This paper takes you from the basics of charts and graphs to visualizing big data using SAS Visual Analytics.
-
 E-Book
Improving Customer ExperienceEveryone makes better decisions with easy access to powerful, interactive analytics – no matter the size of the business. This e-book profiles seven organizations that are using self-service data visualization and exploration to make big improvements in the way they work.
E-Book
Improving Customer ExperienceEveryone makes better decisions with easy access to powerful, interactive analytics – no matter the size of the business. This e-book profiles seven organizations that are using self-service data visualization and exploration to make big improvements in the way they work.
-
 White Paper
Workforce AnalyticsThis paper explores how government HR functions can use advanced analytics, machine learning and AI to develop effective plans to meet hiring, retention and performance goals.
White Paper
Workforce AnalyticsThis paper explores how government HR functions can use advanced analytics, machine learning and AI to develop effective plans to meet hiring, retention and performance goals.
-
 White Paper
TDWI Checklist Report: Gaining Business Value from Governed Analytics and Discoverydata governance
White Paper
TDWI Checklist Report: Gaining Business Value from Governed Analytics and Discoverydata governance
-
 Customer Story
University uses analytics to ensure student successWestern Kentucky University uses data visualization and advanced analytics to make informed decisions.
Customer Story
University uses analytics to ensure student successWestern Kentucky University uses data visualization and advanced analytics to make informed decisions.
-
 Customer Story
Better reporting yields better understanding of risk managementSAS Visual Analytics helps Erste Bank Croatia tackle diverse data for accurate analysis.
Customer Story
Better reporting yields better understanding of risk managementSAS Visual Analytics helps Erste Bank Croatia tackle diverse data for accurate analysis.
-
 Customer Story
Valencia College uses data-driven approach to improve outcomes in higher educationSAS Visual Analytics empowers administrators to easily manage enrollment, and adjust class availability and resources to help students succeed.
Customer Story
Valencia College uses data-driven approach to improve outcomes in higher educationSAS Visual Analytics empowers administrators to easily manage enrollment, and adjust class availability and resources to help students succeed.
-
 White Paper
The Use of Open Source is Growing. So Why Do Organizations Still Turn to SAS?This conclusions paper summarizes a session at the 2014 Hadoop Summit presented by Brian Garrett, Principal Solutions Architect at SAS Institute Inc. titled, “With the Rise of Open Source, Why Organizations Still Turn to SAS.” In it, he explains why corporate analytics requirements are best served when companies run both SAS enterprise-class analytics solutions and open source solutions together. Garrett explains how these technologies meet different needs and co-exist well. He also highlights recent SAS software enhancements that allow analysts to incorporate R algorithms into analytic processes as part of a comprehensive, enterprise-class SAS analytics platform.
White Paper
The Use of Open Source is Growing. So Why Do Organizations Still Turn to SAS?This conclusions paper summarizes a session at the 2014 Hadoop Summit presented by Brian Garrett, Principal Solutions Architect at SAS Institute Inc. titled, “With the Rise of Open Source, Why Organizations Still Turn to SAS.” In it, he explains why corporate analytics requirements are best served when companies run both SAS enterprise-class analytics solutions and open source solutions together. Garrett explains how these technologies meet different needs and co-exist well. He also highlights recent SAS software enhancements that allow analysts to incorporate R algorithms into analytic processes as part of a comprehensive, enterprise-class SAS analytics platform.
-
 Article
Is your data too big to visualize?Use these tips to find new ways to look at big data, so you can quickly collapse and condense the results in an intuitive fashion.
Article
Is your data too big to visualize?Use these tips to find new ways to look at big data, so you can quickly collapse and condense the results in an intuitive fashion.
-
 Interview
Data visualization: A wise investment in your big data futureData visualization technologies can help the practice of data-driven decision making really take hold. But putting data visualization software in the hands of business users? Is it crazy – or crazy smart?
Interview
Data visualization: A wise investment in your big data futureData visualization technologies can help the practice of data-driven decision making really take hold. But putting data visualization software in the hands of business users? Is it crazy – or crazy smart?
-
 White Paper
Fast and FuriousWhite paper for IT that explains the components and deployment options for SAS Visual Analytics.
White Paper
Fast and FuriousWhite paper for IT that explains the components and deployment options for SAS Visual Analytics.
-
 White Paper
Building an Analytical Culture for SuccessAn ambitious, culture-centric project reshaped people’s attitudes about data and quickly returned more than a $1 million in cost savings. See the six guiding principles that led to success where three earlier attempts had failed.
White Paper
Building an Analytical Culture for SuccessAn ambitious, culture-centric project reshaped people’s attitudes about data and quickly returned more than a $1 million in cost savings. See the six guiding principles that led to success where three earlier attempts had failed.
-
 E-Book
Augmented Analytics: The secret ingredient to better business intelligenceAugmented analytics breaks down the limitations of
business intelligence (BI) and brings forward insights
from data using AI and machine learning.
E-Book
Augmented Analytics: The secret ingredient to better business intelligenceAugmented analytics breaks down the limitations of
business intelligence (BI) and brings forward insights
from data using AI and machine learning.

Related Offerings
Check out these products and solutions related to SAS Visual Analytics.