
SAS Visual Analytics
Ora tutti possono facilmente scoprire e condividere informazioni di valore che ispirano le decisioni.

Un'unica applicazione per il reporting, l'esplorazione dei dati e le analisi
-

Ottieni una visione globale senza tralasciare i collegamenti meno evidenti.
Individua rapidamente le relazioni importanti nei tuoi dati utilizzando suggerimenti e misure correlate identificative. Utilizza il machine learning e le spiegazioni in linguaggio naturale per trovare, visualizzare e raccontare storie e approfondimenti che siano facili da comprendere e spiegare. Scopri il motivo per cui si è verificata un’azione, esamina tutte le opzioni e scopri le opportunità nascoste nei tuoi dati Evidenzia automaticamente le relazioni principali, gli outlier, i cluster e altro ancora per far emergere nuove informazioni di valore da cui trarre ispirazione per le tue azioni future.
-

Passa dalla semplice osservazione alla conoscenza approfondita grazie agli elementi visivi dinamici.
Genera report e dashboard interattivi straordinari. Crea un riepilogo veloce degli indicatori fondamentali delle prestazioni e condividilo su web e su dispositivi mobili. I decisori aziendali possono interagire rapidamente e in modo collaborativo con le informazioni, analizzandone ogni aspetto per trovare risposte individuali e acquisire una visione globale delle performance aziendali.
-

Ottieni risposte supportate da dati, risultati guidati dagli insight
L’analisi predittiva di facile utilizzo consente agli analisti aziendali di valutare i possibili risultati e prendere decisioni data-driven, anche senza conoscenze di programmazione. Gli algoritmi intelligenti riducono la necessità di sperimentare manualmente. Inoltre, collaborando con personale esperto, potrai focalizzarti sulle attività più significative.
-

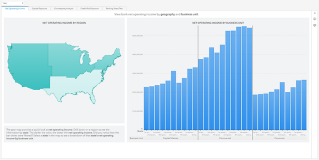
Aggiungi il "dove" al "cosa".
Aggiungi un contesto geografico alle tue analisi e visualizzazioni combinando i dati tradizionali con quelli relativi alla localizzazione. L'analisi della location porta in primo piano la dimensione del "dove" per consentirti di analizzare i dati in modi diversi e acquisire una vista globale prima di prendere decisioni, individuando opportunità specifiche per ogni location.
-

Semplifica il processo di scoperta
La data preparation self-service consente agli utenti aziendali di importare i propri dati, unire tabelle, applicare funzioni di data quality, creare colonne calcolate e altro, il tutto tramite l’intuitiva funzionalità drag-and-drop. Consentendo agli utenti di accedere, combinare, pulire e preparare i dati in modo facile e sicuro, SAS Visual Analytics semplifica, accelera ed estende l’adozione degli analytics a tutta l'organizzazione.
-

Sfrutta il meglio di entrambe le piattaforme
Utilizza gli strumenti di produttività di Microsoft 365 per acceder agli analytics SAS. Approfondisci l'analisi dei tuoi dati, accedi e interagisci con i report in SAS Visual Analytics e integra gli approfondimenti nelle applicazioni Microsoft come Excel e Outlook. E poi condividili con i tuoi collaboratori.


Funzionalità principali
Reporting interattivo. Visual discovery. Self-service analytics. Scalabilità e governance dei dati. Tutte queste funzionalità sono disponibili in un unico ed efficace ambiente in-memory.
Embedded insights
Incorpora singoli approfondimenti visuali dai report di SAS Visual Analytics, costruisci storie interattive o incorpora l'intero report o la pagina interattiva nelle tue applicazioni web personalizzate. Pubblica i tuoi approfondimenti in linea con la flessibilità dei dati in tempo reale o delle istantanee di dati incorporati per creare una data storytelling.
App SAS Visual Analytics per dispositivi mobili
Utilizza le app mobili native per iOS e Android per visualizzare e interagire con gli altri attraverso report e dashboard dinamici su tablet e smartphone.
Integrazione aperta per gli sviluppatori
Aggiungi una visualizzazione creativa con librerie JavaScript di terze parti, come D3 e C3, con piena interattività all'interno di SAS Visual Analytics. Sfrutta le risorse di sviluppo open source per gli sviluppatori e le API REST per qualsiasi linguaggio client per accedere agli analytics, ai dati e ai servizi SAS.
Scopri SAS Visual Analytics

Demo interattive
Guarda i demo interattivi di SAS Visual Analytics e scopri com’è facile esplorare e comprendere i dati per affrontare con successo le sfide aziendali e quelle di settore.
-
 BANKING
Banking & Risk InsightsGet a holistic view of risk and performance across regions, down to the individual counterparty level.
BANKING
Banking & Risk InsightsGet a holistic view of risk and performance across regions, down to the individual counterparty level.
-
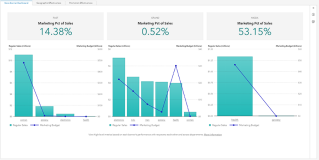 RETAIL & CONSUMER GOODS
Retail InsightsAnalyze regional store performance, and make data-driven decisions about retail business functions.
RETAIL & CONSUMER GOODS
Retail InsightsAnalyze regional store performance, and make data-driven decisions about retail business functions.
-
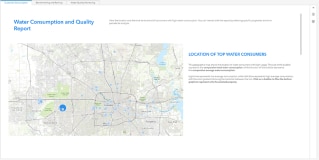 UTILITIES
Water Consumption & QualityMonitor the quality and consumption of this critical natural resource.
UTILITIES
Water Consumption & QualityMonitor the quality and consumption of this critical natural resource.
-
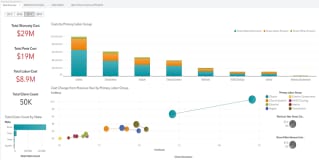 MANUFACTURING
Warranty AnalysisAnalyze warranty claims to quickly identify potential issues and their underlying causes.
MANUFACTURING
Warranty AnalysisAnalyze warranty claims to quickly identify potential issues and their underlying causes.
-
 PUBLIC HEALTH
Emerging Disease Surveillance & ForecastingCreate an automated, insightful and transparent surveillance program for use in detecting new disease activity and tracking seasonal diseases.
PUBLIC HEALTH
Emerging Disease Surveillance & ForecastingCreate an automated, insightful and transparent surveillance program for use in detecting new disease activity and tracking seasonal diseases.

SAS Viya è cloud-native e cloud-agnostic
Utilizza SAS come vuoi – SAS managed o self-managed. E dove vuoi.


Per saperne di più su SAS Visual Analytics e oltre
Sfoglia le risorse per tipologia.
-
- Seleziona il tipo di risorsa
- ANALYST REPORT
- ARTICOLO
- Blog Post
- Case Study
- E-book
- Estratto
- Infografica
- Intervista
- Ricerca
- Serie
- Testimonianza
- Video
- Webinar
- White Paper
-
 Testimonianza
Delivering new levels of transparency and equity in carbon market transactionsFairClimateFund works with SAS and Notilyze to increase transparency and traceability in carbon markets, helping drive more equitable climate financing while expanding access to clean cooking solutions that benefit low-income households.
Testimonianza
Delivering new levels of transparency and equity in carbon market transactionsFairClimateFund works with SAS and Notilyze to increase transparency and traceability in carbon markets, helping drive more equitable climate financing while expanding access to clean cooking solutions that benefit low-income households.
-
 Testimonianza
AI and cloud fuel bank’s new era of fast, reliable credit risk reportingAbsa Bank streamlines reporting, optimizes compliance processes and advances model governance with SAS® Viya® on Amazon Web Services.
Testimonianza
AI and cloud fuel bank’s new era of fast, reliable credit risk reportingAbsa Bank streamlines reporting, optimizes compliance processes and advances model governance with SAS® Viya® on Amazon Web Services.
-
 Testimonianza
Streamlining financial management with advanced analyticsFidelidade, Portugal’s leading insurance company, uses SAS Asset and Liability Management for strategic decision making.
Testimonianza
Streamlining financial management with advanced analyticsFidelidade, Portugal’s leading insurance company, uses SAS Asset and Liability Management for strategic decision making.
-
 Testimonianza
Strengthening information security and governance with unified risk managementAskari Bank is enhancing information security, governance and operations by unifying risk and compliance through SAS Governance and Compliance Manager, improving data integrity, transparency and workflow effectiveness.
Testimonianza
Strengthening information security and governance with unified risk managementAskari Bank is enhancing information security, governance and operations by unifying risk and compliance through SAS Governance and Compliance Manager, improving data integrity, transparency and workflow effectiveness.
-
 Testimonianza
Automating credit decisions for a digital-first futureNexent Bank Romania relies on SAS Viya to facilitate real-time credit decisions, boosting productivity and customer satisfaction.
Testimonianza
Automating credit decisions for a digital-first futureNexent Bank Romania relies on SAS Viya to facilitate real-time credit decisions, boosting productivity and customer satisfaction.
-
 Testimonianza
Transforming logistics and package delivery with data and AIRelais Colis relies on SAS Viya on Microsoft Azure to optimize productivity and growth.
Testimonianza
Transforming logistics and package delivery with data and AIRelais Colis relies on SAS Viya on Microsoft Azure to optimize productivity and growth.
-
 E-book
Decisions you can trust: A strategic guide to trustworthy data and AI decision makingDiscover how decision intelligence ensures AI agents act with context, ethics and transparency – delivering scalable, auditable and trusted outcomes.
E-book
Decisions you can trust: A strategic guide to trustworthy data and AI decision makingDiscover how decision intelligence ensures AI agents act with context, ethics and transparency – delivering scalable, auditable and trusted outcomes.
-
 Testimonianza
Enhancing credit management with data and analyticsTIM, the largest telecom provider in Italy, uses SAS Viya to optimize credit operations and support real-time decision making in a complex regulatory environment.
Testimonianza
Enhancing credit management with data and analyticsTIM, the largest telecom provider in Italy, uses SAS Viya to optimize credit operations and support real-time decision making in a complex regulatory environment.
-
 Testimonianza
Accelerating drug discovery with AI innovationWith SAS Viya, Shionogi developed a system to semiautomate clinical trials without compromising safety, efficacy or compliance.
Testimonianza
Accelerating drug discovery with AI innovationWith SAS Viya, Shionogi developed a system to semiautomate clinical trials without compromising safety, efficacy or compliance.
-
 Testimonianza
Predictive analytics and AI deliver a winning fan experienceThe Orlando Magic uses mobile app data and SAS to personalize marketing campaigns and boost fan engagement.
Testimonianza
Predictive analytics and AI deliver a winning fan experienceThe Orlando Magic uses mobile app data and SAS to personalize marketing campaigns and boost fan engagement.
-
 Testimonianza
Getting more people behind the wheel with predictive modeling and personalized financing solutionsToyota Financial Services Italia uses SAS Viya to better understand customers, tailor communications and customize financing options for buying or leasing vehicles.
Testimonianza
Getting more people behind the wheel with predictive modeling and personalized financing solutionsToyota Financial Services Italia uses SAS Viya to better understand customers, tailor communications and customize financing options for buying or leasing vehicles.
-
 Testimonianza
Integrating data, generative AI and human expertise to tackle global warming The Southern States Energy Board uses SAS Viya to analyze and manage vast amounts of geological, regulatory and community sentiment data with speed and precision.
Testimonianza
Integrating data, generative AI and human expertise to tackle global warming The Southern States Energy Board uses SAS Viya to analyze and manage vast amounts of geological, regulatory and community sentiment data with speed and precision.
-
 E-book
Government navigating an uncertain worldHow governments can harness data,
advanced analytics, and trustworthy AI to
prepare for the unexpected—and respond
faster to protect and improve citizens’ lives.
E-book
Government navigating an uncertain worldHow governments can harness data,
advanced analytics, and trustworthy AI to
prepare for the unexpected—and respond
faster to protect and improve citizens’ lives.
-
 Testimonianza
Award-winning bank’s data-driven strategy boosts productivity, efficiency and customer centricityAn ‘analytics for all’ approach helps Banca Intesa Beograd foster informed decision making, innovation and sustainable growth.
Testimonianza
Award-winning bank’s data-driven strategy boosts productivity, efficiency and customer centricityAn ‘analytics for all’ approach helps Banca Intesa Beograd foster informed decision making, innovation and sustainable growth.
-
 Testimonianza
AI helps students graduate from collegeHillsborough (FL) Community College uses SAS® Visual Analytics to determine what students need to complete their degrees
Testimonianza
AI helps students graduate from collegeHillsborough (FL) Community College uses SAS® Visual Analytics to determine what students need to complete their degrees
-
 Testimonianza
One airport operator is making every journey personal for passengersiGA Istanbul Airport creates personalized customer journeys using SAS® MarTech solutions
Testimonianza
One airport operator is making every journey personal for passengersiGA Istanbul Airport creates personalized customer journeys using SAS® MarTech solutions
-
 Testimonianza
Jakarta Smart City uses IoT analytics to better serve residentsJakarta and SAS team up to create an award-winning approach to public services and disaster management.
Testimonianza
Jakarta Smart City uses IoT analytics to better serve residentsJakarta and SAS team up to create an award-winning approach to public services and disaster management.
-
 Testimonianza
Managing Dutch roads and waterways with intelligenceA modern AI, IoT and analytics platform powered by SAS Viya helps Rijkswaterstaat move from reactive to predictive infrastructure maintenance.
Testimonianza
Managing Dutch roads and waterways with intelligenceA modern AI, IoT and analytics platform powered by SAS Viya helps Rijkswaterstaat move from reactive to predictive infrastructure maintenance.
-
 Testimonianza
Advanced analytics helps policymakers determine how new tax measures would affect citizensAscertaining the ‘winners’ and ‘losers’ of potential tax changes before regulations are implemented.
Testimonianza
Testimonianza
Advanced analytics helps policymakers determine how new tax measures would affect citizensAscertaining the ‘winners’ and ‘losers’ of potential tax changes before regulations are implemented.
-
 Testimonianza
Optimizing cancer patient care with advanced analyticsSAS Viya helps create custom care pathways for Oscar Lambret Center cancer patients.
Testimonianza
Optimizing cancer patient care with advanced analyticsSAS Viya helps create custom care pathways for Oscar Lambret Center cancer patients.
-
 Testimonianza
Automated safety reporting protects hospital patients in NorwayHelse Nord uses SAS to automate its hospitals’ processes and halves their workload.
Testimonianza
Automated safety reporting protects hospital patients in NorwayHelse Nord uses SAS to automate its hospitals’ processes and halves their workload.
-
 Testimonianza
Taking the guesswork out of production planningEuramax uses SAS to prevent production delays
Testimonianza
Taking the guesswork out of production planningEuramax uses SAS to prevent production delays
-
 Testimonianza
Hospitals save time and money with real-time medical device tracking Jan Yperman Hospital uses Blyott and SAS Visual Analytics on SAS Viya to monitor hospital asset locations and ensure optimal purchasing decisions.
Testimonianza
Hospitals save time and money with real-time medical device tracking Jan Yperman Hospital uses Blyott and SAS Visual Analytics on SAS Viya to monitor hospital asset locations and ensure optimal purchasing decisions.
-
 Testimonianza
Improving data collection and modeling to accelerate predictive medicine effortsDompé farmaceutici uses SAS for predictive analytics and quantitative disease modeling.
Testimonianza
Improving data collection and modeling to accelerate predictive medicine effortsDompé farmaceutici uses SAS for predictive analytics and quantitative disease modeling.
-
 Testimonianza
Enhancing road safety with advanced analyticsBelgium’s FPS Justice uses insights from SAS Visual Analytics to crack down on excessive speeding and take more effective action against traffic violators.
Testimonianza
Enhancing road safety with advanced analyticsBelgium’s FPS Justice uses insights from SAS Visual Analytics to crack down on excessive speeding and take more effective action against traffic violators.
-
 Testimonianza
Ensuring public transparency and one-stop access to crime data and analysisThe North Carolina Criminal Justice Analysis Center uses SAS Viya on SAS Cloud to improve data accessibility and efficiencies in gathering and reporting state and county criminal justice statistics to stakeholders, policymakers and citizens.
Testimonianza
Ensuring public transparency and one-stop access to crime data and analysisThe North Carolina Criminal Justice Analysis Center uses SAS Viya on SAS Cloud to improve data accessibility and efficiencies in gathering and reporting state and county criminal justice statistics to stakeholders, policymakers and citizens.
-
 ARTICOLO
Are you good at scoring?Credit scoring is the foundation for evaluating clients who apply for a loan (or other types of exposure for the bank). It is not unusual for it to take up to 12 months to build and deploy a new credit scoring model. Reforming the process will help minimize losses, increase earnings and reduce operational risk.
ARTICOLO
Are you good at scoring?Credit scoring is the foundation for evaluating clients who apply for a loan (or other types of exposure for the bank). It is not unusual for it to take up to 12 months to build and deploy a new credit scoring model. Reforming the process will help minimize losses, increase earnings and reduce operational risk.
-
 Testimonianza
One of the largest multi-sport clubs in Portugal aims to win big with analyticsSport Lisboa e Benfica modernizes its operations with SAS Analytics, as it looks to expand internationally.
Testimonianza
One of the largest multi-sport clubs in Portugal aims to win big with analyticsSport Lisboa e Benfica modernizes its operations with SAS Analytics, as it looks to expand internationally.
-
 Testimonianza
Analytics helps major public health system run efficient programs and improve patient careThe Los Angeles County Department of Health Services relies on advanced analytics from SAS to meet federal regulations, ensure financial viability and better serve a diverse population of more than 10 million people.
Testimonianza
Analytics helps major public health system run efficient programs and improve patient careThe Los Angeles County Department of Health Services relies on advanced analytics from SAS to meet federal regulations, ensure financial viability and better serve a diverse population of more than 10 million people.
-
 Testimonianza
It’s all in the research: Using AI to solve issues in health careWith the University of Alberta's new health data management and analysis platform, DARC, it can now increase research capacity and provide high-performance computing and data storage in a secure environment. SAS provided the university software to help make its platform thrive amidst a global pandemic.
Testimonianza
It’s all in the research: Using AI to solve issues in health careWith the University of Alberta's new health data management and analysis platform, DARC, it can now increase research capacity and provide high-performance computing and data storage in a secure environment. SAS provided the university software to help make its platform thrive amidst a global pandemic.
-
 Testimonianza
Analytic models spotlight risky loansItaly’s Ministry of Economy and Finance uses advanced analytics on SAS Viya to quickly calculate risk on financial guarantees.
Testimonianza
Analytic models spotlight risky loansItaly’s Ministry of Economy and Finance uses advanced analytics on SAS Viya to quickly calculate risk on financial guarantees.
-
 Testimonianza
Italy’s second-largest hospital uses advanced analytics for effective pandemic responseGemelli University Hospital uses SAS solutions to predict admissions of patients in the intensive care units and impacts on the organization, from staffing hospital wards to effectively scheduling and managing COVID-19 vaccine administration.
Testimonianza
Italy’s second-largest hospital uses advanced analytics for effective pandemic responseGemelli University Hospital uses SAS solutions to predict admissions of patients in the intensive care units and impacts on the organization, from staffing hospital wards to effectively scheduling and managing COVID-19 vaccine administration.
-
 Testimonianza
Finland’s top retail bank applies AI to improve customer service and credit scoringS-Bank provides better customer service and faster, more accurate loan processing time using SAS Viya on Azure.
Testimonianza
Finland’s top retail bank applies AI to improve customer service and credit scoringS-Bank provides better customer service and faster, more accurate loan processing time using SAS Viya on Azure.
-
 Testimonianza
Real-time analytics helps telecom provider adapt to changing customer needs during global pandemic and beyondTelefónica Ecuador accelerates digital transformation, improves campaigns and achieves growth via intelligent decisioning powered by SAS.
Testimonianza
Real-time analytics helps telecom provider adapt to changing customer needs during global pandemic and beyondTelefónica Ecuador accelerates digital transformation, improves campaigns and achieves growth via intelligent decisioning powered by SAS.
-
 Testimonianza
Transforming the consumer banking experience through advanced analyticsCIMB Singapore uses SAS Viya to enhance business operations and keep pace with changing customer needs.
Testimonianza
Transforming the consumer banking experience through advanced analyticsCIMB Singapore uses SAS Viya to enhance business operations and keep pace with changing customer needs.
-
 Testimonianza
Analytics helps ensure fair and balanced pay structures across Sweden’s public sectorTietoEVRY and SAS partner to help Sweden's largest employer organization, Adda, offer a nationally aggregated salary planning tool for municipalities and regions across the country.
Testimonianza
Analytics helps ensure fair and balanced pay structures across Sweden’s public sectorTietoEVRY and SAS partner to help Sweden's largest employer organization, Adda, offer a nationally aggregated salary planning tool for municipalities and regions across the country.
-
 Webinar
Getting Started With Geo Analysis in SAS® Visual AnalyticsSeeing is believing. Learn the geo analysis capabilities available in SAS Visual Analytics, available out of the box and through Esri integration.
Webinar
Getting Started With Geo Analysis in SAS® Visual AnalyticsSeeing is believing. Learn the geo analysis capabilities available in SAS Visual Analytics, available out of the box and through Esri integration.
-
 Testimonianza
Travel and tourism forecasts become more accurate with analyticsDER Touristik builds web-based planning tool with SAS to better predict future demand and quickly react to changes in the market.
Testimonianza
Travel and tourism forecasts become more accurate with analyticsDER Touristik builds web-based planning tool with SAS to better predict future demand and quickly react to changes in the market.
-
 Testimonianza
La smart city usa gli analytics e l'IoT per prevedere e gestire gli eventi alluvionaliLa città di Cary, NC, collabora con SAS e Microsoft per proteggere i cittadini dalle inondazioni, salvaguardare gli spartiacque e sostenere uno sviluppo ecocompatibile.
Testimonianza
La smart city usa gli analytics e l'IoT per prevedere e gestire gli eventi alluvionaliLa città di Cary, NC, collabora con SAS e Microsoft per proteggere i cittadini dalle inondazioni, salvaguardare gli spartiacque e sostenere uno sviluppo ecocompatibile.
-
 ARTICOLO
From living on the streets to owning a profitable businessZoe Empowers, a ministry for vulnerable children living in life-threatening poverty in Africa and India, finally found a way to measure and reveal its incredible impact. Using SAS, they developed an "empowerment index" that measures improvements in housing, health, education and more for program participants.
ARTICOLO
From living on the streets to owning a profitable businessZoe Empowers, a ministry for vulnerable children living in life-threatening poverty in Africa and India, finally found a way to measure and reveal its incredible impact. Using SAS, they developed an "empowerment index" that measures improvements in housing, health, education and more for program participants.
-
 Testimonianza
Gli Analytics per massimizzare l’assistenza sanitaria al pazientePer ottimizzare la fruizione dell’immenso patrimonio informativo aziendale, il Policlinico Agostino Gemelli ha avviato nel gennaio 2019 un progetto per la migrazione sulla piattaforma SAS® Viya. Risultati: disponibilità dei dati in tempo quasi-reale e valutazione delle prestazioni basate su benchmark.
Testimonianza
Gli Analytics per massimizzare l’assistenza sanitaria al pazientePer ottimizzare la fruizione dell’immenso patrimonio informativo aziendale, il Policlinico Agostino Gemelli ha avviato nel gennaio 2019 un progetto per la migrazione sulla piattaforma SAS® Viya. Risultati: disponibilità dei dati in tempo quasi-reale e valutazione delle prestazioni basate su benchmark.
-
 Testimonianza
A model of institutional research champions the value of analytics for allOklahoma State University uses SAS to create an analytics culture and increase student success.
Testimonianza
A model of institutional research champions the value of analytics for allOklahoma State University uses SAS to create an analytics culture and increase student success.
-
 Testimonianza
Forecasting accuracy brings ‘new energy’ to CameroonEnergy supplier Eneo balances supply and demand to boost efficiency, save millions and improve reliability with SAS Energy Forecasting.
Testimonianza
Forecasting accuracy brings ‘new energy’ to CameroonEnergy supplier Eneo balances supply and demand to boost efficiency, save millions and improve reliability with SAS Energy Forecasting.
-
 Testimonianza
Artificial intelligence and IoT analytics keep aircraft operational for crucial missionsLockheed Martin revolutionizes aircraft maintenance with the SAS Platform.
Testimonianza
Artificial intelligence and IoT analytics keep aircraft operational for crucial missionsLockheed Martin revolutionizes aircraft maintenance with the SAS Platform.
-
 Testimonianza
Property experts open analytics to new marketsNVM enhances real estate analytics with SAS Viya open architecture.
Testimonianza
Property experts open analytics to new marketsNVM enhances real estate analytics with SAS Viya open architecture.
-
 Testimonianza
Boosting institutional research with data governance and self-service reportingThe University of Idaho invests in SAS to give administrators access to trusted, insight-rich data.
Testimonianza
Boosting institutional research with data governance and self-service reportingThe University of Idaho invests in SAS to give administrators access to trusted, insight-rich data.
-
 Testimonianza
Automated laboratories improve uptime with analyticsPredictive service and maintenance keeps Siemens Healthineers lab tests running on time.
Testimonianza
Automated laboratories improve uptime with analyticsPredictive service and maintenance keeps Siemens Healthineers lab tests running on time.
-
 White Paper
Tar Heels Play to Win With SAS Analytics Learn how Carolina Athletics and its fundraising arm, The Rams Club, use SAS Analytics to deepen existing relationships and broaden a longstanding tradition of loyalty to all 28 of their university sports.
White Paper
Tar Heels Play to Win With SAS Analytics Learn how Carolina Athletics and its fundraising arm, The Rams Club, use SAS Analytics to deepen existing relationships and broaden a longstanding tradition of loyalty to all 28 of their university sports.
-
 Testimonianza
Self-service analytics advances higher educationThe University of Central Florida depends on analytics and data visualization to uncover insights for increased student success.
Testimonianza
Self-service analytics advances higher educationThe University of Central Florida depends on analytics and data visualization to uncover insights for increased student success.
-
 Testimonianza
Smart data exploration advances K-12 public education programsThe South Carolina Department of Education depends on SAS to analyze data and properly fund and serve its school districts.
Testimonianza
Smart data exploration advances K-12 public education programsThe South Carolina Department of Education depends on SAS to analyze data and properly fund and serve its school districts.
-
 ARTICOLO
Location intelligence: Adding geospatial context to BI Get tips for implementing a location intelligence data strategy from industry thought leader and data explorer, Jen Underwood.
ARTICOLO
Location intelligence: Adding geospatial context to BI Get tips for implementing a location intelligence data strategy from industry thought leader and data explorer, Jen Underwood.
-
 Testimonianza
Achieving academic and operational excellence through business intelligenceCurtin University uses SAS Visual Analytics to provide reporting across the organization.
Testimonianza
Achieving academic and operational excellence through business intelligenceCurtin University uses SAS Visual Analytics to provide reporting across the organization.
-
 White Paper
The Power of CollaborationThis white paper explains the need for and value of the collaboration and self-service capabilities that SAS Visual Analytics and SAS Office Analytics provide. It provides how-to specifics for incorporating SAS Visual Analytics results with Microsoft Outlook, Excel, PowerPoint, Word and SharePoint with plenty of screen shots, explanations and architecture diagrams for IT.
White Paper
The Power of CollaborationThis white paper explains the need for and value of the collaboration and self-service capabilities that SAS Visual Analytics and SAS Office Analytics provide. It provides how-to specifics for incorporating SAS Visual Analytics results with Microsoft Outlook, Excel, PowerPoint, Word and SharePoint with plenty of screen shots, explanations and architecture diagrams for IT.
-
 Intervista
Location analytics: Why adding where makes BI betterLearn how location analytics can enrich your BI endeavors by blending geographic data, spatial analysis and business data for deeper insights.
Intervista
Location analytics: Why adding where makes BI betterLearn how location analytics can enrich your BI endeavors by blending geographic data, spatial analysis and business data for deeper insights.
-
 White Paper
Redefine Your Analytics Journey With Interactive Data Exploration and Predictive AnalyticsWhat if your analytics journey were easier? It can be, in five easy steps. Learn how SAS Visual Analytics and SAS Visual Statistics together can provide a fast, fun way to explore data, build models and find the best performer.
White Paper
Redefine Your Analytics Journey With Interactive Data Exploration and Predictive AnalyticsWhat if your analytics journey were easier? It can be, in five easy steps. Learn how SAS Visual Analytics and SAS Visual Statistics together can provide a fast, fun way to explore data, build models and find the best performer.
-
 White Paper
Data Visualization TechniquesA picture is worth a thousand words – especially when you are trying to find relationships and understand your data – which could include thousands or even millions of variables. This paper takes you from the basics of charts and graphs to visualizing big data using SAS Visual Analytics.
White Paper
Data Visualization TechniquesA picture is worth a thousand words – especially when you are trying to find relationships and understand your data – which could include thousands or even millions of variables. This paper takes you from the basics of charts and graphs to visualizing big data using SAS Visual Analytics.
-
 White Paper
Workforce AnalyticsThis paper explores how government HR functions can use advanced analytics, machine learning and AI to develop effective plans to meet hiring, retention and performance goals.
White Paper
Workforce AnalyticsThis paper explores how government HR functions can use advanced analytics, machine learning and AI to develop effective plans to meet hiring, retention and performance goals.
-
 White Paper
TDWI Checklist Report: Gaining Business Value from Governed Analytics and Discoverydata governance
White Paper
TDWI Checklist Report: Gaining Business Value from Governed Analytics and Discoverydata governance
-
 Testimonianza
University uses analytics to ensure student successWestern Kentucky University uses data visualization and advanced analytics to make informed decisions.
Testimonianza
University uses analytics to ensure student successWestern Kentucky University uses data visualization and advanced analytics to make informed decisions.
-
 Testimonianza
Valencia College uses data-driven approach to improve outcomes in higher educationSAS Visual Analytics empowers administrators to easily manage enrollment, and adjust class availability and resources to help students succeed.
Testimonianza
Valencia College uses data-driven approach to improve outcomes in higher educationSAS Visual Analytics empowers administrators to easily manage enrollment, and adjust class availability and resources to help students succeed.
-
 White Paper
The Use of Open Source is Growing. So Why Do Organizations Still Turn to SAS?This conclusions paper summarizes a session at the 2014 Hadoop Summit presented by Brian Garrett, Principal Solutions Architect at SAS Institute Inc. titled, “With the Rise of Open Source, Why Organizations Still Turn to SAS.” In it, he explains why corporate analytics requirements are best served when companies run both SAS enterprise-class analytics solutions and open source solutions together. Garrett explains how these technologies meet different needs and co-exist well. He also highlights recent SAS software enhancements that allow analysts to incorporate R algorithms into analytic processes as part of a comprehensive, enterprise-class SAS analytics platform.
White Paper
The Use of Open Source is Growing. So Why Do Organizations Still Turn to SAS?This conclusions paper summarizes a session at the 2014 Hadoop Summit presented by Brian Garrett, Principal Solutions Architect at SAS Institute Inc. titled, “With the Rise of Open Source, Why Organizations Still Turn to SAS.” In it, he explains why corporate analytics requirements are best served when companies run both SAS enterprise-class analytics solutions and open source solutions together. Garrett explains how these technologies meet different needs and co-exist well. He also highlights recent SAS software enhancements that allow analysts to incorporate R algorithms into analytic processes as part of a comprehensive, enterprise-class SAS analytics platform.
-
 ARTICOLO
Is your data too big to visualize?Use these tips to find new ways to look at big data, so you can quickly collapse and condense the results in an intuitive fashion.
ARTICOLO
Is your data too big to visualize?Use these tips to find new ways to look at big data, so you can quickly collapse and condense the results in an intuitive fashion.
-
 Intervista
Data visualization: A wise investment in your big data futureData visualization technologies can help the practice of data-driven decision making really take hold. But putting data visualization software in the hands of business users? Is it crazy – or crazy smart?
Intervista
Data visualization: A wise investment in your big data futureData visualization technologies can help the practice of data-driven decision making really take hold. But putting data visualization software in the hands of business users? Is it crazy – or crazy smart?
-
 White Paper
Fast and FuriousWhite paper for IT that explains the components and deployment options for SAS Visual Analytics.
White Paper
Fast and FuriousWhite paper for IT that explains the components and deployment options for SAS Visual Analytics.
-
 E-book
Augmented Analytics: The secret ingredient to better business intelligenceAugmented analytics breaks down the limitations of
business intelligence (BI) and brings forward insights
from data using AI and machine learning.
E-book
Augmented Analytics: The secret ingredient to better business intelligenceAugmented analytics breaks down the limitations of
business intelligence (BI) and brings forward insights
from data using AI and machine learning.
-
 White Paper
Building an Analytical Culture for SuccessAn ambitious, culture-centric project reshaped people’s attitudes about data and quickly returned more than a $1 million in cost savings. See the six guiding principles that led to success where three earlier attempts had failed.
White Paper
Building an Analytical Culture for SuccessAn ambitious, culture-centric project reshaped people’s attitudes about data and quickly returned more than a $1 million in cost savings. See the six guiding principles that led to success where three earlier attempts had failed.
-
 Testimonianza
Better reporting yields better understanding of risk managementSAS Visual Analytics helps Erste Bank Croatia tackle diverse data for accurate analysis.
Testimonianza
Better reporting yields better understanding of risk managementSAS Visual Analytics helps Erste Bank Croatia tackle diverse data for accurate analysis.

Offerte correlate
Dai un'occhiata a questi prodotti e soluzioni relative a SAS Visual Analytics.