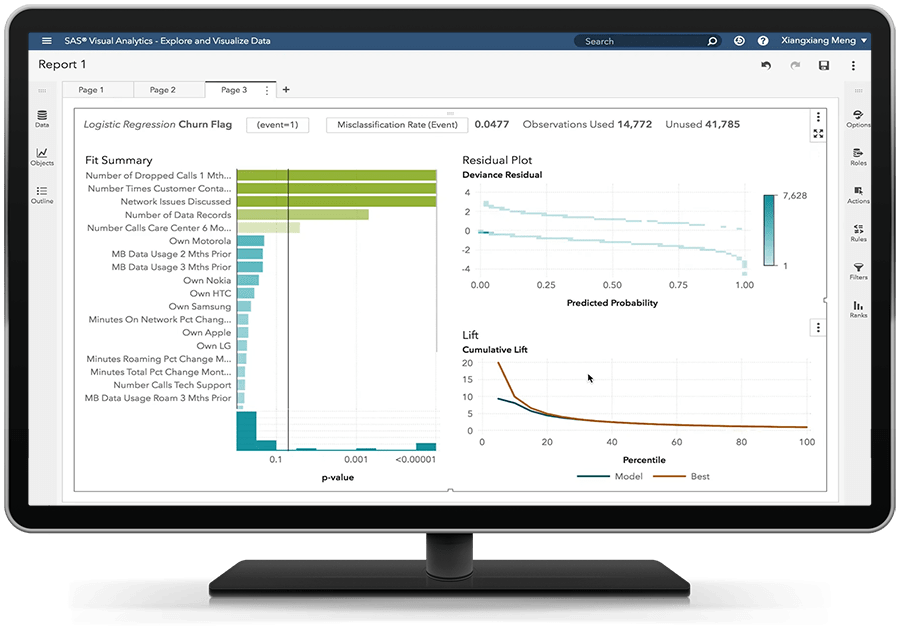
В этой системе множество пользователей могут исследовать данные, а затем создавать и уточнять описательные и прогнозные модели в интерактивном режиме.

Находите новые возможности раньше конкурентов
Ваши специалисты по данным и статистике смогут принимать решения с учетом подробной информации о наблюдениях, используя наиболее подходящие методы аналитического моделирования. Результат? Вы будете получать ценную информацию с невообразимой скоростью и открывать новые способы увеличения прибыли.
Быстро вводите новые модели в эксплуатацию
С легкостью создавайте и совершенствуйте модели, адаптированные для конкретных групп или сегментов. Запускайте несколько сценариев одновременно. Находите ответы на вопросы «Что, если…?» и повышайте результативность. Принимайте решения на основе результатов с помощью автоматически генерируемого кода оценки.


Повышайте эффективность решения аналитических задач
Предоставляйте самым разным пользователям возможность работать с данными (добавлять и менять переменные, удалять отклонения и т. п.) при помощи графических инструментов. Мгновенно узнавайте, как изменения повлияют на качество прогнозов модели, и оперативно вносите изменения. Работать с аналитическими алгоритмами SAS можно из других сред с помощью выбранного вами языка программирования (Python, Java, R или Lua).
Свобода экспериментировать.
Команды data-специалистов используют свои навыки максимально гибко и продуктивно, когда работают на удобном им языке программирования. SAS Visual Statistics в рамках общего решения объединяет все активы аналитики, созданные с помощью SAS или других языков, таких как R, Python, Java или Lua.

KEY FEATURES
Interactive data exploration and discovery combined with the ability to easily build and adjust huge numbers of predictive models on the fly.
Data access, preparation & quality
Access, profile, cleanse and transform data using an intuitive interface that provides self-service data preparation capabilities with embedded AI.
Custom chatbot creation
Create and deploy custom, natural language chatbots via an intuitive, low-code visual interface for chatbot-enabled insights and conversational user experiences.
Data visualization
Visually explore data, and create and share smart visualizations and interactive reports through a single, self-service interface. Augmented analytics and advanced capabilities accelerate insights and help you uncover stories hidden in your data.
Descriptive & predictive modeling
Explore and evaluate segments visually for further analysis using k-means clustering, scatter plots and detailed summary statistics. Use machine learning techniques to build predictive models from a visual or programming interface.
Open, code-based model development
Programmatically access analytical actions from SAS Studio, call them from other languages – Python, R, Lua, Java – or use public REST APIs to add SAS Analytics to existing applications.
Dynamic group-by processing
Concurrently build models and process results for each group or segment without having to sort or index data each time.
Model comparison, assessment and scoring
Generate model comparison summaries (lift charts, ROC charts, concordance statistics, misclassification tables) on one or more models. Export models as SAS DATA step code, and apply them to new data.
Powered by SAS® Viya®
SAS Viya has a completely redesigned architecture that is compact, cloud native and fast. Whether you prefer to use the SAS Cloud or a public or private cloud provider, you'll be able to make the most of your cloud investment.
ОБЛАЧНЫЕ ПРОВАЙДЕРЫ
Решайте весь спектр аналитических задачи быстрее с помощью облачных технологий – от экспериментов до критически важных операционных процессов. Последняя версия платформы SAS Viya теперь доступна с помощью поставщиков облачных услуг.
Explore More on SAS® Visual Statistics and Beyond
To browse resources by type, select an option below.
-
- Select Resource Type
- Аналитический отчет
- E-Book
- Технический документ
- Article
- Blog Post
- Book Excerpt
- Case Study
- Infographic
- Interview
- Research
- Series
- Video
- Customer Story
- Вебинар
- Аналитический отчет В 2020 году SAS снова занял ведущую позицию в Gartner Magic Quadrant для платформ Data Science & Machine LearningSAS седьмой год подряд занимает ведущую позицию рейтинга Gartner Magic Quadrant для платформ Data Science & Machine Learning
- Технический документ Redefine Your Analytics Journey With Interactive Data Exploration and Predictive AnalyticsWhat if your analytics journey were easier? It can be, in five easy steps. Learn how SAS Visual Analytics and SAS Visual Statistics together can provide a fast, fun way to explore data, build models and find the best performer.
- Технический документ Big Data, Analytics and HadoopSAS and Hadoop are natural partners. Hadoop provides distributed storage and processing power. SAS treats Hadoop as just another data source and complements it with data management, data discovery and advanced analytics. This conclusions paper highlights two ways you can work with Hadoop data from within a familiar and interactive SAS Analytics environment – either with the graphical user interface of SAS® Visual Statistics or streamlined programming via SAS In-Memory Statistics for Hadoop.
- Технический документ Fast and Furious: Big Data Analytics Meets HadoopConclusions paper from a presentation at the 2014 Strata Santa Clara big data conference, in which two SAS data experts demonstrated new ways of gaining insights from big data at speeds that will redefine how organizations solve complex problems.
- Технический документ The Use of Open Source is Growing. So Why Do Organizations Still Turn to SAS?This conclusions paper summarizes a session at the 2014 Hadoop Summit presented by Brian Garrett, Principal Solutions Architect at SAS Institute Inc. titled, “With the Rise of Open Source, Why Organizations Still Turn to SAS.” In it, he explains why corporate analytics requirements are best served when companies run both SAS enterprise-class analytics solutions and open source solutions together. Garrett explains how these technologies meet different needs and co-exist well. He also highlights recent SAS software enhancements that allow analysts to incorporate R algorithms into analytic processes as part of a comprehensive, enterprise-class SAS analytics platform.
- Customer Story Artificial intelligence and IoT analytics keep aircraft operational for crucial missionsLockheed Martin revolutionizes aircraft maintenance with the SAS Platform.
- Customer Story Cancer treatment enters a new era with artificial intelligenceAmsterdam UMC uses the SAS Platform and AI solutions to increase speed and accuracy of tumor evaluations.
- Customer Story Zeroing in on property values with machine learningArtificial intelligence improves assessment accuracy and productivity in Wake County.
- Customer Story University aces data strategy to retain more studentsBetter student outcomes, million-dollar savings just the beginning for the University of North Texas.
Связанные решения
Узнайте о продуктах связанных с SAS Visual Statistics, и построенных на SAS® Platform.