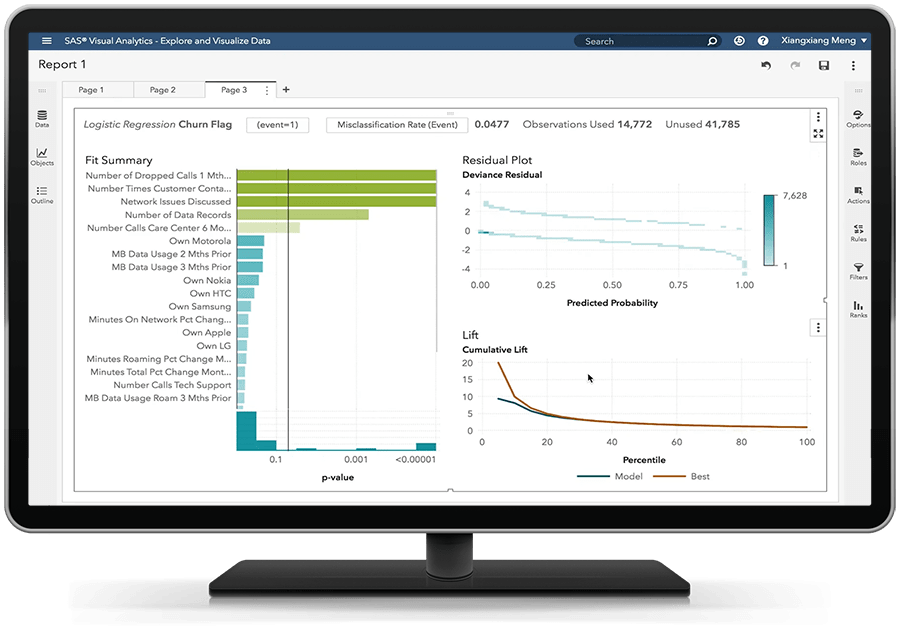
Interactive data exploration and discovery combined with the ability to easily build and adjust huge numbers of predictive models on the fly.
Descriptive and predictive modeling
Visually explore and evaluate segments for further analysis using k-means clustering, scatter plots and detailed summary statistics. Use machine learning techniques to build predictive models from a visual or programming interface.
Open, code-based model development
Programmatically access analytical actions from SAS Studio, call them from other languages – Python, R, Lua, Java – or use public REST APIs to add SAS Analytics to existing applications.
Dynamic group-by processing
Concurrently build models and process results for each group or segment without having to sort or index data each time.
Model comparison, assessment and scoring
Generate model comparison summaries (lift charts, ROC charts, concordance statistics, misclassification tables) on one or more models. Export models as SAS DATA step code, and apply them to new data.
Distributed, in-memory analytical processing
Uses in-memory analytical processing to provide answers to a range of business questions in a single, scalable and governed environment.
Flexible deployment options
Runs on commodity hardware, in a private or public cloud infrastructure or Cloud Foundry platform as a service (PaaS).
Multiple users can explore data, then interactively create and refine predictive models.

Uncover opportunities faster than your competitors.
Your data scientists and statisticians can act on observations at a granular level using the most appropriate analytical modeling techniques. The result? You'll unearth insights at unprecedented speeds, and find new ways to grow revenue.
Put better models into action faster.
Easily build and refine models to target specific groups or segments, and run numerous scenarios simultaneously. You can ask more what-if questions to get better results. And put results into action with automatically generated score code.


Boost analytical productivity.
Empower multiple users to interact with data visually – to add or change variables, remove outliers, etc. Instantly see how changes affect your model's predictive power, and make refinements quickly.
Gain the freedom to experiment.
Data science teams have the ultimate flexibility of working in their language of choice, so they can use their skills to the fullest. SAS Visual Statistics unites all analytical assets – whether created using SAS or other languages like R, Python, Java or Lua – within a common solution.

Explore More on SAS® Visual Statistics and Beyond
To browse resources by type, select an option below.
-
- Select Resource Type
- Analyst Report
- Article
- Blog Post
- Book Excerpt
- Case Study
- Customer Story
- E-Book
- Infographic
- Interview
- Research
- Series
- Video
- Webinar
- White Paper
- White Paper
- Customer Story Boosting institutional research with data governance and self-service reportingThe University of Idaho invests in SAS to give administrators access to trusted, insight-rich data.
-
White Paper
Using Analytics With Open Data to Build a Stronger Government
Learn how governments can use open data and SAS to pinpoint, analyze, solve and predict problems and uncover new opportunities.
- Customer Story Zeroing in on property values with machine learningArtificial intelligence improves assessment accuracy and productivity in Wake County.
-
E-Book
How Any Size Organization Can Supersize Results With Data Visualization
Everyone makes better decisions with easy access to powerful, interactive analytics – no matter the size of the business. This e-book profiles six organizations that are using self-service data visualization and exploration to make big improvements in the way they work.
- Customer Story A model of institutional research champions the value of analytics for allOklahoma State University uses SAS to create an analytics culture and increase student success.
- Customer Story University aces data strategy to retain more studentsBetter student outcomes, million-dollar savings just the beginning for the University of North Texas.
- Customer Story Better customer service via machine learningAdvanced analytics helps Rogers Communications become more customer-centric, cutting customer complaints in half.
-
White Paper
Redefine Your Analytics Journey With Interactive Data Exploration and Predictive Analytics
What if your analytics journey were easier? It can be, in five easy steps. Learn how SAS Visual Analytics and SAS Visual Statistics together can provide a fast, fun way to explore data, build models and find the best performer.
- Customer Story Artificial intelligence and IoT analytics keep aircraft operational for crucial missionsLockheed Martin revolutionizes aircraft maintenance with the SAS Platform.
- Customer Story Cancer treatment enters a new era with artificial intelligenceAmsterdam UMC uses the SAS Platform and AI solutions to increase speed and accuracy of tumor evaluations.
- Customer Story Targeted offers give hockey fans the royal treatmentLA Kings extend hot streak off the ice with analytics-grounded customer intelligence.
Related Products
Check out these products related to SAS Visual Statistics, built on the powerful SAS® Platform.
- SAS/ACCESS® SoftwareRead, write and update data regardless of its native database or platform.
- SAS/STAT®Take advantage of extensive statistical capabilities to meet the data analysis needs of your entire organization.
- SAS® Visual AnalyticsVisually explore all data, discover new patterns and publish reports to the web and mobile devices.
- SAS® Viya®Conquer your analytics challenges, from experimental to mission critical, with faster decisions in the cloud. SAS Viya enables everyone –data scientists, business analysts, developers and executives alike – to collaborate, scale and operationalize insights, everywhere.