
Interactive Demos
SAS Visual Analytics
Explore industry and business issues through interactive visualizations and easy-to-use analytics.
Available Demos
-
 BANKING
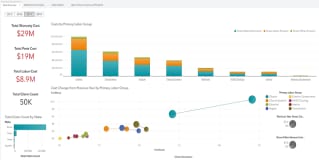
Banking & Risk InsightsGet a holistic view of risk and performance across regions, down to the individual counterparty level.
BANKING
Banking & Risk InsightsGet a holistic view of risk and performance across regions, down to the individual counterparty level.
-
 PUBLIC HEALTH
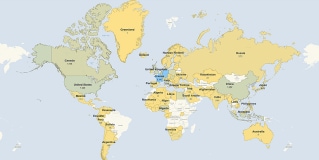
Emerging Disease Surveillance & ForecastingCreate an automated, insightful and transparent surveillance program for use in detecting new disease activity and tracking seasonal diseases.
PUBLIC HEALTH
Emerging Disease Surveillance & ForecastingCreate an automated, insightful and transparent surveillance program for use in detecting new disease activity and tracking seasonal diseases.
-
 RETAIL & CONSUMER GOODS
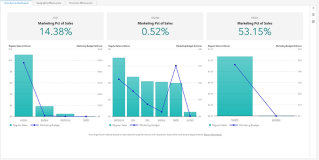
Retail InsightsAnalyze regional store performance, and make data-driven decisions about retail business functions.
RETAIL & CONSUMER GOODS
Retail InsightsAnalyze regional store performance, and make data-driven decisions about retail business functions.
-
 MANUFACTURING
Warranty AnalysisAnalyze warranty claims to quickly identify potential issues and their underlying causes.
MANUFACTURING
Warranty AnalysisAnalyze warranty claims to quickly identify potential issues and their underlying causes.
-
 UTILITIES
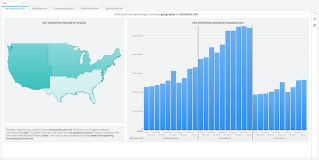
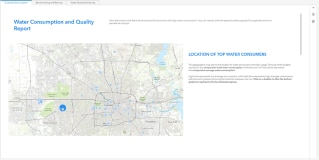
Water Consumption & QualityMonitor the quality and consumption of this critical natural resource.
UTILITIES
Water Consumption & QualityMonitor the quality and consumption of this critical natural resource.
Want to explore SAS Visual Analytics further?
Get a free, 14-day trial of SAS Viya, which provides capabilities for the entire analytics life cycle, including SAS Visual Analytics.