UNIVARIATEプロシジャ
- 概要
-
入門ガイド

-
構文
-
詳細
欠損値 丸め 記述統計量 モードの計算 パーセント点の計算 位置の検定 正規分布のパラメータに対する信頼限界 ロバスト推定量 ラインプリンタプロットの作成 高解像度グラフの作成 CLASSステートメントを使用した比較プロットの作成 インセットの配置 当てはめた連続分布の計算式 適合度検定 核密度推定 Q-Qプロットと確率プロットの作成 Q-Qプロットと確率プロットの解釈 確率プロットとQ-Qプロットの分布 Q-Qプロットを使用した形状パラメータの推定 Q-Qプロットを使用した位置パラメータと尺度パラメータの推定 Q-Qプロットを使用したパーセント点の推定 入力データセット OUTPUTステートメントのOUT=出力データセット OUTHISTOGRAM=出力データセット OUTKERNEL=出力データセット OUTTABLE=出力データセット 要約統計量のテーブル ODSテーブル名 当てはめた分布のODSテーブル ODS Graphics 計算リソース
-
例
複数の変数に対する記述統計量の計算 モードの計算 極値のオブザベーションと極値の表示 度数表の作成 ラインプリンタ出力プロットの作成 FREQ変数を使用したデータセットの分析 OUT=出力データセットへの要約統計量の保存 出力データセットへのパーセント点の保存 平均、標準偏差、分散に対する信頼限界の計算 分位点とパーセント点に対する信頼限界の計算 ロバスト推定の計算 位置の検定 対応のあるデータを使用した符号検定の実行 ヒストグラムの作成 一元比較ヒストグラムの作成 二元比較ヒストグラムの作成 記述統計量を含むインセットの追加 ヒストグラムのビン幅の指定 正規曲線をヒストグラムに追加する 当てはめた正規曲線を比較ヒストグラムに追加する ベータ曲線の当てはめ 対数正規曲線、Weibull曲線、ガンマ曲線の当てはめ 核密度推定の計算 3パラメータ対数正規曲線の当てはめ 折り重ねられた正規曲線の追加表示 対数正規確率プロットの作成 対数正規分布の当てはめを表示するヒストグラムの作成 正規確率プロットの作成 分布の参照線の追加 正規確率プロットの解釈 対数正規確率プロットから3パラメータを推定する 対数正規確率プロットからパーセント点を推定する 対数正規確率プロットからパラメータを推定する Weibull分布の分位点プロットの比較 累積分布プロットの作成 P-Pプロットの作成
- リファレンス
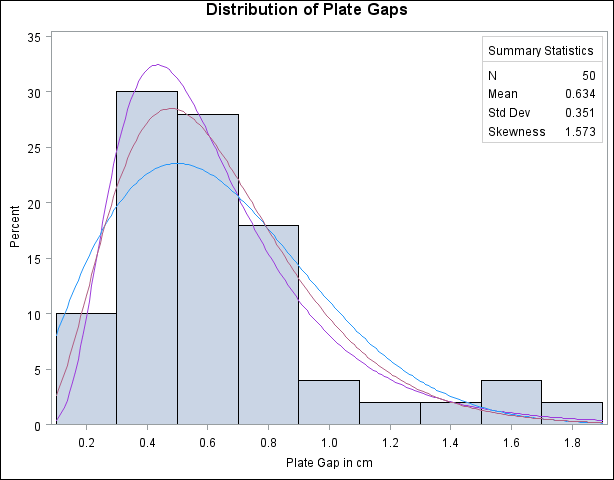
例4.22 対数正規曲線、Weibull曲線、ガンマ曲線の当てはめ
適切なデータ分布モデルを決定するには、いくつかの分布族の曲線を検討する必要があります。この例で示すように、HISTOGRAMステートメントを使用して複数の分布を当てはめ、それらの密度曲線を1つのヒストグラムに表示することができます。
溶接工程の生産品から無作為に50個の溶接済み組み立て品を選択し、各組立品の2つの金属板の間の隙間(cm)を測定します。次のステートメントはPlatesという名前のデータセットに測定値(Gap)を保存します。
data Plates;
   label Gap = 'Plate Gap in cm';
   input Gap @@;
   datalines;
0.746  0.357  0.376  0.327  0.485 1.741  0.241  0.777  0.768  0.409
0.252  0.512  0.534  1.656  0.742 0.378  0.714  1.121  0.597  0.231
0.541  0.805  0.682  0.418  0.506 0.501  0.247  0.922  0.880  0.344
0.519  1.302  0.275  0.601  0.388 0.450  0.845  0.319  0.486  0.529
1.547  0.690  0.676  0.314  0.736 0.643  0.483  0.352  0.636  1.080
;
次のステートメントは3つの分布(対数正規、Weibullおよびガンマ)を当てはめ、それらの密度曲線を1つのヒストグラムに表示します。
title 'Distribution of Plate Gaps';
ods graphics off;
ods select ParameterEstimates GoodnessOfFit FitQuantiles MyHist;
proc univariate data=Plates;
   var Gap;
   histogram / midpoints=0.2 to 1.8 by 0.2
               lognormal
               weibull
               gamma
               vaxis   = axis1
               name    = 'MyHist';
   inset n mean(5.3) std='Std Dev'(5.3) skewness(5.3)
          / pos = ne  header = 'Summary Statistics';
   axis1 label=(a=90 r=0);
run;
ODS SELECTステートメントは出力を"ParameterEstimates"、"GoodnessOfFit"および"FitQuantiles"の各テーブルに制限します。ODSテーブル名のセクションを参照してください。LOGNORMAL、WEIBULLおよびGAMMA 1次オプションは、当てはめた曲線を出力4.22.1のヒストグラムに重ねて表示するよう要求します。各曲線でしきい値パラメータは であることが前提になっています。しきい値が0ではない場合は、THETA= 2次オプションで
 を指定できます。
LOGNORMAL、WEIBULLおよびGAMMAオプションは、出力4.22.2~出力4.22.4に示されている当てはめた分布の要約も作成します。
出力4.22.2は、対数正規分布に対する3つのEDF適合度検定(Anderson-Darling、Cramér-von MisesおよびKolmogorov-Smirnov検定)を示しています。 有意水準で、2パラメータ対数正規分布(尺度パラメータ
 および形状パラメータ
 )が金属板の隙間の分布モデルに適しているという結論が、すべての検定で支持されます。
| Distribution of Plate Gaps |
| Parameters for Lognormal Distribution | ||
|---|---|---|
| Parameter | Symbol | Estimate |
| Threshold | Theta | 0 |
| Scale | Zeta | -0.58375 |
| Shape | Sigma | 0.499546 |
| Mean | 0.631932 | |
| Std Dev | 0.336436 | |
| Goodness-of-Fit Tests for Lognormal Distribution | ||||
|---|---|---|---|---|
| Test | Statistic | p Value | ||
| Kolmogorov-Smirnov | D | 0.06441431 | Pr > D | >0.150 |
| Cramer-von Mises | W-Sq | 0.02823022 | Pr > W-Sq | >0.500 |
| Anderson-Darling | A-Sq | 0.24308402 | Pr > A-Sq | >0.500 |
| Quantiles for Lognormal Distribution | ||
|---|---|---|
| Percent | Quantile | |
| Observed | Estimated | |
| 1.0 | 0.23100 | 0.17449 |
| 5.0 | 0.24700 | 0.24526 |
| 10.0 | 0.29450 | 0.29407 |
| 25.0 | 0.37800 | 0.39825 |
| 50.0 | 0.53150 | 0.55780 |
| 75.0 | 0.74600 | 0.78129 |
| 90.0 | 1.10050 | 1.05807 |
| 95.0 | 1.54700 | 1.26862 |
| 99.0 | 1.74100 | 1.78313 |
| Distribution of Plate Gaps |
| Parameters for Weibull Distribution | ||
|---|---|---|
| Parameter | Symbol | Estimate |
| Threshold | Theta | 0 |
| Scale | Sigma | 0.719208 |
| Shape | C | 1.961159 |
| Mean | 0.637641 | |
| Std Dev | 0.339248 | |
| Goodness-of-Fit Tests for Weibull Distribution | ||||
|---|---|---|---|---|
| Test | Statistic | p Value | ||
| Cramer-von Mises | W-Sq | 0.15937281 | Pr > W-Sq | 0.016 |
| Anderson-Darling | A-Sq | 1.15693542 | Pr > A-Sq | <0.010 |
| Quantiles for Weibull Distribution | ||
|---|---|---|
| Percent | Quantile | |
| Observed | Estimated | |
| 1.0 | 0.23100 | 0.06889 |
| 5.0 | 0.24700 | 0.15817 |
| 10.0 | 0.29450 | 0.22831 |
| 25.0 | 0.37800 | 0.38102 |
| 50.0 | 0.53150 | 0.59661 |
| 75.0 | 0.74600 | 0.84955 |
| 90.0 | 1.10050 | 1.10040 |
| 95.0 | 1.54700 | 1.25842 |
| 99.0 | 1.74100 | 1.56691 |
出力4.22.3は、Weibull分布に対する2つのEDF適合度検定(Anderson-DarlingおよびCramér-von Mises検定)を示しています。EDF検定の 値はすべて0.10より小さく、このデータがWeibullモデルを支持しないことを示しています。
| Distribution of Plate Gaps |
| Parameters for Gamma Distribution | ||
|---|---|---|
| Parameter | Symbol | Estimate |
| Threshold | Theta | 0 |
| Scale | Sigma | 0.155198 |
| Shape | Alpha | 4.082646 |
| Mean | 0.63362 | |
| Std Dev | 0.313587 | |
| Goodness-of-Fit Tests for Gamma Distribution | ||||
|---|---|---|---|---|
| Test | Statistic | p Value | ||
| Kolmogorov-Smirnov | D | 0.09695325 | Pr > D | >0.250 |
| Cramer-von Mises | W-Sq | 0.07398467 | Pr > W-Sq | >0.250 |
| Anderson-Darling | A-Sq | 0.58106613 | Pr > A-Sq | 0.137 |
| Quantiles for Gamma Distribution | ||
|---|---|---|
| Percent | Quantile | |
| Observed | Estimated | |
| 1.0 | 0.23100 | 0.13326 |
| 5.0 | 0.24700 | 0.21951 |
| 10.0 | 0.29450 | 0.27938 |
| 25.0 | 0.37800 | 0.40404 |
| 50.0 | 0.53150 | 0.58271 |
| 75.0 | 0.74600 | 0.80804 |
| 90.0 | 1.10050 | 1.05392 |
| 95.0 | 1.54700 | 1.22160 |
| 99.0 | 1.74100 | 1.57939 |
有意水準で、ガンマ分布(尺度パラメータ および形状パラメータ
 )が金属板の隙間の分布モデルに適しているという結論が、すべての検定で支持されます。
この分析に基づき、当てはめた対数正規分布と当てはめたガンマ分布の2つのモデルが金属板の隙間の分布に適しています。
この例のサンプルプログラムuniex13.sasは、Base SASソフトウェアのSASサンプルライブラリに含まれています。