例2.2 変数の2つの組み合わせの相関を計算
次のステートメントは、データセットSetosaを作成します。このデータセットには、Fisher’s iris data (1936)からの4種類のデータ(萼片長、萼片幅、花弁長、花弁幅)が含まれます。このデータセットは、複数の欠損値を含むように変更されています。
*------------------- Data on Iris Setosa --------------------*
| The data set contains 50 iris specimens from the species   |
| Iris Setosa with the following four measurements:          |
| SepalLength (sepal length)                                 |
| SepalWidth  (sepal width)                                  |
| PetalLength (petal length)                                 |
| PetalWidth  (petal width)                                  |
| Certain values were changed to missing for the analysis.   |
*------------------------------------------------------------*;
data Setosa;
  input SepalLength SepalWidth PetalLength PetalWidth @@;
  label sepallength='Sepal Length in mm.'
        sepalwidth='Sepal Width in mm.'
        petallength='Petal Length in mm.'
        petalwidth='Petal Width in mm.';
  datalines;
50 33 14 02  46 34 14 03  46 36 .  02
51 33 17 05  55 35 13 02  48 31 16 02
52 34 14 02  49 36 14 01  44 32 13 02
50 35 16 06  44 30 13 02  47 32 16 02
48 30 14 03  51 38 16 02  48 34 19 02
50 30 16 02  50 32 12 02  43 30 11 .
58 40 12 02  51 38 19 04  49 30 14 02
51 35 14 02  50 34 16 04  46 32 14 02
57 44 15 04  50 36 14 02  54 34 15 04
52 41 15 .   55 42 14 02  49 31 15 02
54 39 17 04  50 34 15 02  44 29 14 02
47 32 13 02  46 31 15 02  51 34 15 02
50 35 13 03  49 31 15 01  54 37 15 02
54 39 13 04  51 35 14 03  48 34 16 02
48 30 14 01  45 23 13 03  57 38 17 03
51 38 15 03  54 34 17 02  51 37 15 04
52 35 15 02  53 37 15 02
;
次のステートメントは、萼片の測定値(長さと幅)と花弁の測定値(長さと幅)という2種類の変数の組み合わせ間の相関分析を要求します。
ods graphics on;
title 'Fisher (1936) Iris Setosa Data';
proc corr data=Setosa sscp cov plots=matrix;
   var  sepallength sepalwidth;
   with petallength petalwidth;
run;
ods graphics off;
出力2.2.1の表"Simple Statistics"に、VARステートメントとWITHステートメントで指定した変数に関する、分析変数の1変量統計量を示します。
出力2.2.1 Simple Statistics
The CORR Procedure
| PetalLength PetalWidth |
| SepalLength SepalWidth |
| 49 |
14.71429 |
1.62019 |
721.00000 |
11.00000 |
19.00000 |
Petal Length in mm. |
| 48 |
2.52083 |
1.03121 |
121.00000 |
1.00000 |
6.00000 |
Petal Width in mm. |
| 50 |
50.06000 |
3.52490 |
2503 |
43.00000 |
58.00000 |
Sepal Length in mm. |
| 50 |
34.28000 |
3.79064 |
1714 |
23.00000 |
44.00000 |
Sepal Width in mm. |
WITHステートメントとVARステートメントを組み合わせて指定すると、CORRプロシジャは、共分散や相関などの統計量を表す矩形行列を作成します。この行列の行はWITH変数(PetalLengthとPetalWidth)に、この行列の列はVAR変数(SepalLengthとSepalWidth)にそれぞれ対応しています。CORRプロシジャは、WITH変数のラベルを使用して、この行列の列をラベル付けします。
SSCPオプションを指定すると、無修正平方和と交差積行列の表が作成されます。COVオプションを指定すると、共分散行列の表が作成されます。SSCPオプションおよびCOVオプションを指定すると、Pearson相関の表も作成されます。
各変数ペアに関する平方和と交差積統計量は、欠損値でない行と列の変数値を持つオブザベーションを使用して計算されます。出力2.2.2の表"Sums of Squares and Crossproducts"には、各変数ペアに関する交差積、行変数の平方和、列変数の平方和が示されています。
出力2.2.2 Sums of Squares and Crossproducts
| 36214.00000 |
| 10735.00000 |
| 123793.0000 |
|
| 24756.00000 |
| 10735.00000 |
| 58164.0000 |
|
| 6113.00000 |
| 355.00000 |
| 121356.0000 |
|
| 4191.00000 |
| 355.00000 |
| 56879.0000 |
|
分散は、欠損値でない行および列変数値を持つオブザベーションを使用して計算されます。出力2.2.3の表"Variances and Covariances"には、各変数ペアに関する共分散、行変数の分散、列変数の分散、関連付けられている自由度が示されています。
出力2.2.3 Variances and Covariances
| 1.270833333 |
| 2.625000000 |
| 12.33333333 |
| 48 |
|
| 1.363095238 |
| 2.625000000 |
| 14.60544218 |
| 48 |
|
| 0.911347518 |
| 1.063386525 |
| 11.80141844 |
| 47 |
|
| 1.048315603 |
| 1.063386525 |
| 13.62721631 |
| 47 |
|
出力2.2.4の表"Pearson Correlation Coefficients"には、相関がゼロの帰無仮説の下の 値と、各変数ペアのオブザベーションの数が表示されています。PetalWidthとSepalLength間の相関と、PetalWidthとSepalWidth間の相関のみがわずかに正となります。
出力2.2.4 Pearson Correlation Coefficients
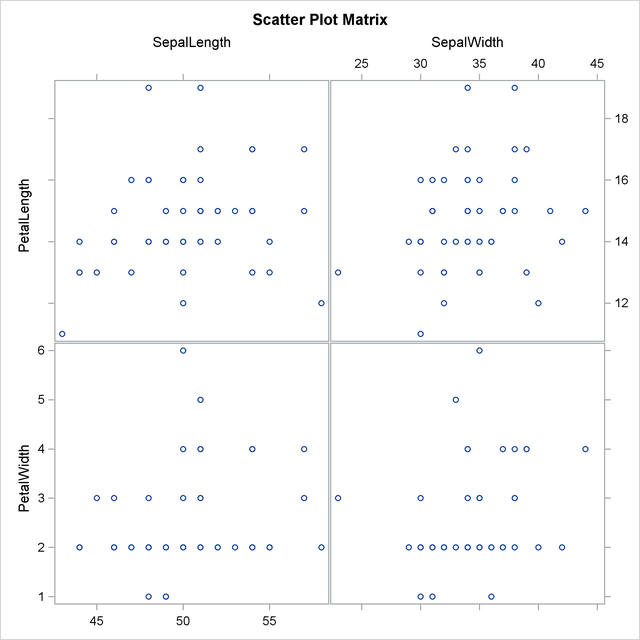
ODS Graphicsを有効にしている場合、PLOTS=オプションを指定するとデフォルトで散布図行列が表示されます。出力2.2.5には、2つの変数の組み合わせの矩形散布図行列が表示されています。VAR変数であるSepalLengthとSepalWidthが行列の最上位行に表示され、WITH変数であるPetalLengthとPetalWidthが行列の左端列に表示されます。 出力2.2.4では、PetalWidthとSepalLengthの散布図と、PetalWidthとSepalWidthの散布図によっても、わずかに正の相関が存在することが示されています。
出力2.2.5 Rectangular Matrix Plot
このグラフ画面を要求するには、ODS Graphicsを有効にし、PLOTS=オプションを指定します。ODS Graphicsの詳細は、Chapter 21, Statistical Graphics Using ODS
(SAS/STAT User's Guide)を参照してください。