G3D Procedure

Example 1: Generating A Surface Plot
| Features: |
PLOT statement |
| Sample library member: | GTDSURFA |
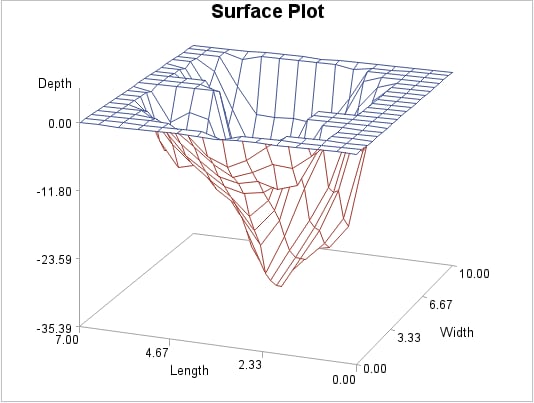
This surface plot reveals
the shape of a generated data set named LAKE. The axes are scaled
to include all data values. Each axis is labeled with the name or
label of the corresponding variable. The tick marks on the axes are
divided into three even intervals. The horizontal plane is rotated
70° around the Z axis. The graph is tilted 70 degrees toward
you. The colors are derived from the ODS style.