G3D Procedure

PLOT Statement
Creates three-dimensional surface plots using values
of three numeric variables from the input data set.
| Restriction: | The AXIS statement is partially supported by the Java and ActiveX devices only. |
| Requirement: | One plot request is required. |
| Global statements: | AXIS, BY, FOOTNOTE, GOPTIONS, NOTE, TITLE |
| Note: | The procedure can include the FORMAT, LABEL, and WHERE statements. |
Syntax
PLOT y*x=z </option(s)>;
Summary of Optional Arguments
Appearance options
specifies an annotate data set to annotate plots
that are produced by the PLOT statement.
specifies a color for the bottom of the plot surface.
specifies a color for the top of the plot surface.
specifies one or more angles at which to rotate
the X-Y plane around the perpendicular Z axis.
produces a surface graph with a side wall.
specifies one or more angles to tilt the graph toward
you.
specifies the direction of lines that are used to
represent the plot's surface.
Axes options
specifies a color for all the axes lines and tick
marks.
specifies a color for the axis labels and axis tick
mark values.
draws reference lines at the major tick marks on
all axes.
specifies that the plot has no axes, axes labels,
or tick mark values.
specifies that the plot has no axis labels or tick
mark values.
assigns an axis definition.
specifies the number of major tick marks that are
located on a plot's x axis.
assigns an axis definition.
specifies the number of major tick marks that are
located on a plot's Y axis.
assigns an axis definition.
specifies the maximum value that is displayed on
a plot's Z axis.
specifies the minimum value that is displayed on
a plot's Z axis.
specifies the number of major tick marks that are
located on a plot's Z axis.
Catalog entry description options
specifies a description of the output.
specifies the name of the GRSEG catalog entry, and
the name of any graphics output file created.
Optional Arguments
Options in a PLOT statement affect all graphs that are produced by that statement. You can specify as many options as you want, and list them in any order.
- ANNOTATE=annotate-data-set
- specifies an annotate data set to annotate plots
that are produced by the PLOT statement. specifies an annotate
data set to annotate plots that are produced by the PLOT statement.Alias:ANNO=
- CAXIS=axis-color
- specifies a color for all the axes lines and tick
marks. specifies a color for
all the axes lines and tick marks.Style reference:Color attribute of the GraphAxisLines elementRestriction:The AXIS statement is partially supported by Java and ActiveX. If the AXIS statement specifies general axis colors with the COLOR= option; the CAXIS= option overrides the AXIS statement general COLOR= option.
- CBOTTOM=bottom-surface-color
- specifies a color for the bottom of the plot surface. specifies a color for
the bottom of the plot surface. Style reference:Color attribute of the GraphData2 elementRestriction:Not supported by Java
- CTEXT=text-color
- specifies a color for the axis labels and axis tick
mark values. specifies a color for
the axis labels and axis tick mark values. The G3D procedure uses
the first color that it finds from the following list: Style reference:Color attribute of the GraphValueText and the GraphLabelText elementsNotes:If you use a BY statement in the procedure, the color of the BY variable label is controlled by the CBY= option in the GOPTIONS statement.
For Java and ActiveX, specific text options specified in the AXIS statement override the CTEXT= option.
- CTOP=top-surface-color
- specifies a color for the top of the plot surface. specifies a color for
the top of the plot surface.Style reference:Color attribute of the GraphData1 element
- DESCRIPTION=“description”
- specifies a description of the output. The maximum length
for description is 256 characters.
The description does not appear in the output. The descriptive text
is shown in each of the following:
-
the chart description for Web output (depending on which device driver you are using). See Chart Descriptions for Web Presentations for more information.
The description can include the #BYLINE, #BYVAL, and #BYVAR substitution options, which work as they do when used on TITLE, FOOTNOTE, and NOTE statements. Refer to Substituting BY Line Values in a Text String. The 256-character limit applies before the substitution takes place for these options. Thus, if in the SAS program the description text exceeds 256 characters, it is truncated to 256 characters, and then the substitution is performed.Alias:DES=Default:3D surface plot of z by x and yRestriction:Partially supported for ActiveX and Java -
- GRID
- draws reference lines at the major tick marks on
all axes. draws reference lines
at the major tick marks on all axes.Restriction:Not supported by Java
- NAME=“name”
- specifies the name of the GRSEG catalog entry, and
the name of any graphics output file created. specifies
the name of the GRSEG catalog entry, and the name of any graphics
output file created. The name can be up to 256 characters long. If
the name duplicates an existing name,
SAS/GRAPH adds a number, or increments the last number used to create a unique graph name–for example G3D1. If the name specified is exactly eight characters long, the last character of the image output file is replaced with a number–for example, myimages is changed to myimage1.Default:Procedure name
- NOAXIS
- specifies that the plot has no axes, axes labels,
or tick mark values. specifies that the
plot has no axes, axes labels, or tick mark values. Use this option
if you want to generate axis labels and tick mark values with an annotate
data set, or with the AXIS statement for Java and ActiveX.Alias:NOAXES
- NOLABEL
- specifies that the plot has no axis labels or tick mark values. specifies that the plot has no axis labels or tick mark values. Use this option if you want to generate axis labels and tick mark values with an annotate data set, or with the AXIS statement for Java and ActiveX.
- ROTATE=angle-list
- specifies one or more angles at which to rotate
the X-Y plane around the perpendicular Z axis. specifies one or more
angles at which to rotate the X-Y plane around the perpendicular Z
axis. Specify the values in degrees. The values specified in the angle-list can be negative or positive. If you
specify a sequence of angles, separate graphs are produced for each
angle. The angles that are specified in the ROTATE= option are paired
with any angles that are specified with the TILT= option. If one option
contains fewer values than the other, the last value in the shorter
list is paired with the remaining values in the longer list. The angle-list list is in one of the following forms:
- SIDE
- produces a surface graph with a side wall. produces a surface
graph with a side wall.Restriction:Partially support by JavaExample:Generating a Tilted Surface Plot
- TILT=angle-list
- specifies one or more angles to tilt the graph toward
you. specifies one or more
angles to tilt the graph toward you. The values must be specified
in degrees. The valid values specified in the angle-list are 0 through 90. To generate a sequence of graphs, specify multiple
angles, a graph is generated for each angle. The angles that are specified
in the TILT= option are paired with any angles that are specified
in the ROTATE= option. If one option contains fewer values than the
other, the last value in the shorter list is paired with the remaining
values in the longer list. The angle-list is in one of the following forms: Default:70 degreesExample:Generating a Tilted Surface Plot
- XAXIS= AXIS<1...<99>
- assigns an axis definition. assigns an axis definition.Restriction:Partially supported by Java and ActiveX only
- XTICKNUM=number-of-major-tick–marks
- specifies the number of major tick marks that are
located on a plot's x axis. specifies the number
of major tick marks that are located on a plot's x axis. At least two values are needed to generate
the axis.Default:4 (except Java and ActiveX are 5)Restriction:Not supported by Java and ActiveX
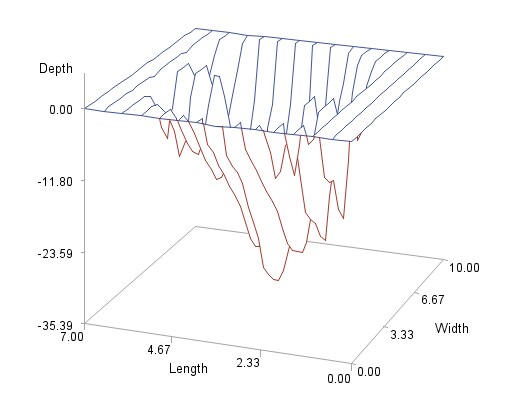
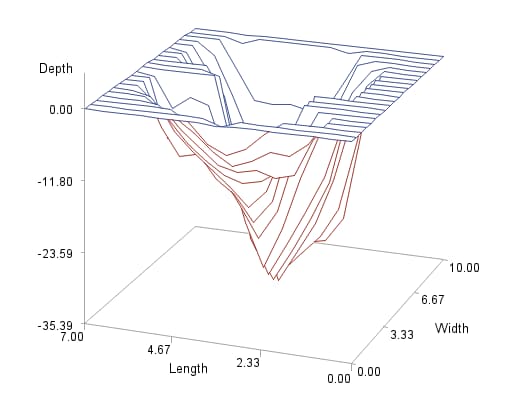
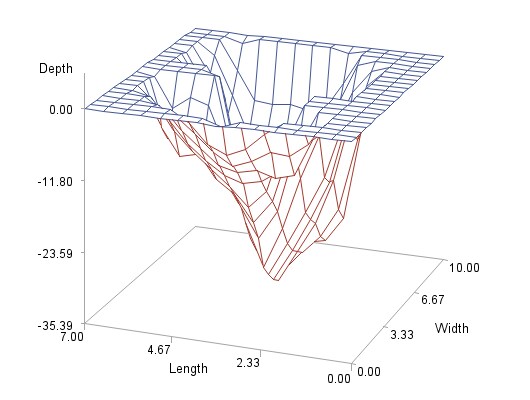
- XYTYPE=0 | 1 | 2 | 3
- specifies the direction of lines that are used to
represent the plot's surface. specifies the direction
of lines that are used to represent the plot's surface. Both X and
Y are displayed by default. The valid values for the XYTYPE= option
are as follows: Restriction:Not supported by JavaExample:Changing the Surface Appearance
- YAXIS=AXIS <1...<99>
- assigns an axis definition. assigns an axis definition.Restriction:Partially supported by Java and ActiveX only
- YTICKNUM=number-of-major-tick-marks
- specifies the number of major tick marks that are
located on a plot's Y axis. specifies the number
of major tick marks that are located on a plot's Y axis. At least
two values are needed to generate the axis.Default:4 (except Java and ActiveX are 5)Restriction:Not supported by Java
- ZAXIS= AXIS<1...<99>
- assigns an axis definition. assigns an axis definition.Restriction:Partially supported by Java and ActiveX only
- ZMAX=maximum-axis-value
- specifies the maximum value that is displayed on
a plot's Z axis. specifies the maximum
value that is displayed on a plot's Z axis. Defining the ZMAX= option
value greater than the data that is in the input data set, extends
the plot's Z axis. Defining the ZMAX= option value less than the maximum
value in the input data set displays all Z values in the range of
ZMIN-to-ZMAX, and might cause data clipping.
Default: The maximum value of the Z variableRestriction:Not supported by Java
- ZMIN=minimum-axis-value
- specifies the minimum value that is displayed on
a plot's Z axis. specifies the minimum
value that is displayed on a plot's Z axis. Defining the ZMIN= option
value less than the minimum value in the input data set extends the
plot's Z axis. Defining the ZMIN= value greater than the minimum value
in the input data set displays all Z values in the range of ZMIN-to-ZMAX,
and might cause data clipping.
Default:The minimum value of the Z variableRestriction:Not supported by Java
- ZTICKNUM=number-of-major-tick-marks
- specifies the number of major tick marks that are
located on a plot's Z axis. specifies the number
of major tick marks that are located on a plot's Z axis. At least
two values are needed to generate the axis.Default:4 (except ActiveX is 5)Restriction:Not supported by Java