G3D Procedure

Rotating and Tilting the Plot
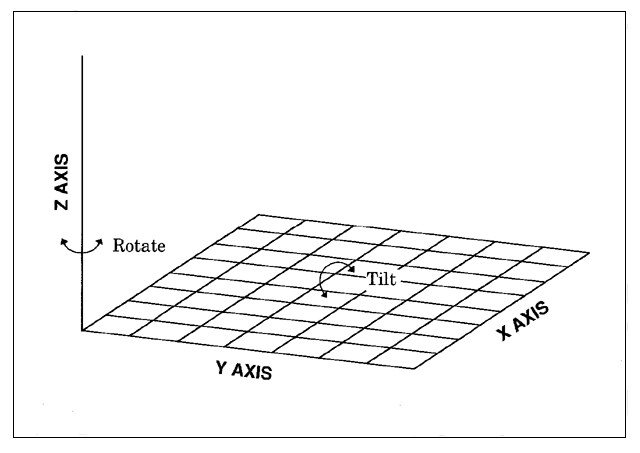
For both surface plots
and scatter plots, you can rotate the X-Y plane around the Z axis,
or tilt the X-Y plane toward you. When you rotate a plot, you can
view data from any angle around the three-dimensional graph. Rotating
a plot is useful for bringing into view data points that might be
obscured by other data points. Tilting a plot enables you to accentuate
the location of data points.