GKPI Procedure

Example 4: Defining a Speedometer
| Features: |
PROC GKPI statement option: MODE=RAISED
|
| Sample library member: | GKPSPD |
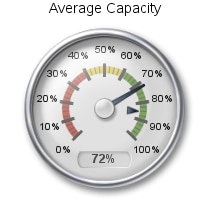
Program
goptions reset=all device=javaimg xpixels=210 ypixels=200;
proc gkpi mode=raised;
   speedometer actual=.72 bounds=(0 .40 .60 1) /   target=.85
   lfont=(f="Albany AMT" height=.5cm) label="Average Capacity"
   format="percent8.0";
run;
quit;
Program Description
Set the graphics environment.The XPIXELS and YPIXELS graphics options reduce the size of the graphics
output area and, therefore, reduce both the size of the KPI chart
and the distance between the label and the KPI chart. These options
scale the KPI charts to a size that would be appropriate for use in
a dashboard.
Generate the KPI chart. Specify
the range boundaries, actual KPI value, and target value. The LFONT=
option specifies the font for the label. The FORMAT= option specifies
the SAS format for the values in the chart.
proc gkpi mode=raised;
   speedometer actual=.72 bounds=(0 .40 .60 1) /   target=.85
   lfont=(f="Albany AMT" height=.5cm) label="Average Capacity"
   format="percent8.0";
run;