GKPI Procedure

Specifying Qualitative Range Boundaries and Actual KPI Values
To generate a KPI chart,
you must specify a list of range boundaries using the BOUNDS= option
and an actual KPI value using the ACTUAL= option. The values can be
positive numbers, negative numbers, or missing (ACTUAL=.), but the
BOUNDS= list must be in either ascending or descending order and must
contain at least two numbers (in order to define a single range).
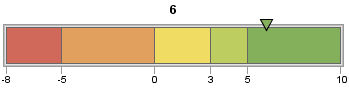
For example, the following code defines a horizontal slider with range
boundaries in ascending order from –8 to 10 and an actual KPI
value of 6:
goptions device=javaimg;
proc gkpi;
   hslider actual=6 bounds=(-8 -5 0 3 5 10);
run;
quit;
The boundaries can also
be specified in desending order, for example:
hslider actual=6 bounds=(10 5 3 0 -5 -8)
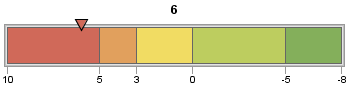
The order in which colors
are applied is not affected by whether boundaries are specified in
ascending or descending order. See Defining Active and Inactive Color Lists for information
about controlling range colors.
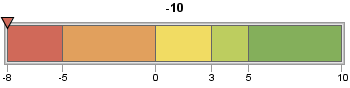
The actual KPI value
can fall outside of the highest or lowest boundaries, but the GKPI
procedure treats such values as if they occur at the edge of the highest
or lowest boundaries. For example, suppose the actual KPI value is
–10, but the lowest boundary value is –8:
hslider actual=-10 bounds=(-8 -5 0 3 5 10)PROC GKPI displays the actual KPI value indicator at –8.