Who Should Attend:
This course is aimed at anyone currently working in a data analyst role who is interested in most effectively communicating their results using data visualisation tools and techniques.
Prerequisites:
To attend this course delegates should be competent in the use of data analysis tools such as reporting tools, spreadsheet software or business intelligence tools.
Course Outline:
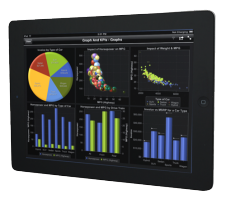
The course is designed to give the user an overview of analysing data using visual techniques. The toolset used will be SAS Visual Analytics. Attendees will use the SAS Visual Analytics tool on real data using a set of Business Use Cases to explore the techniques.
Part 1 – Introduction
- Fundamentals of data visualisation
- From business questions to analysis
- Data.
Part 2 – Answering a Business Question
- Visualisation Use Cases.
- Understanding trends in your data
- Searching for correlations in your data
- Using geographic analysis
- Forecasting
Part 3 – Additional Topics
- Turning your analysis to reports
- Q & A
Date
Wednesday, March 12 2014
Time
9:00 - 12:00
Location
Aviva Stadium, Dublin 4
Click here for directions.
Questions
Please email lauren.brennan@sas.com
