GCONTOUR Procedure

PLOT Statement
Creates contour plots using the values of three
numeric variables from the input data set as the source of the contour
coordinates.
| Requirement: | A plot request is required. |
| Global statements: | AXIS, FOOTNOTE, GOPTIONS, LEGEND, NOTE, PATTERN, SYMBOL, TITLE |
Syntax
PLOT y*x=z </option(s)>;
Summary of Optional Arguments
Appearance options
specifies an Annotate data set to enhance the charts
produced by the PLOT statement.
specifies a color for axis lines, axis tick marks,
and the frame around the plot.
fills the axis area with the specified color.
specifies a color for outlining filled areas.
specifies a color for the axis labels, axis tick
mark values, legend labels, and legend value descriptions.
draws reference lines at all major tick marks on
both axes.
assigns legend characteristics from the corresponding
legend definition to the plot's legend.
specifies that a plot have no axis values, axis
labels, or axis tick marks.
suppresses the frame that is drawn around the plot
area.
suppresses the legend that describes the plot by
displaying the z variable
name or label, the legend values, and legend value descriptions.
Catalog entry description options
specifies a description of the output.
specifies the name of the GRSEG catalog entry and
the name of the graphics output file, if one is created.
Contour options
specifies a color or list of colors for the contour
levels.
combines adjacent grid cells with the same pattern
to form a single pattern area.
specifies up to 100 values for the z variable.
displays filled contour areas with contour lines.
lists line types for plot contour lines.
specifies the number of contour levels to plot.
specifies that the plot contour levels are represented
by rectangles filled with patterns.
produces smooth gradient areas between levels.
Horizontal axis options
displays reference lines originating at the major
tick marks on the horizontal axis.
specifies a color or colors for reference lines
drawn with the HREF= option and the AUTOHREF option.
assigns axis characteristics from the corresponding
axis definition to the horizontal x axis.
specifies the number of minor tick marks to draw
between each major tick mark on the horizontal x axis.
displays up to 100 reference lines originating on
the horizontal x axis at
specified values within the x axis
range.
specifies that the order of the values on the horizontal x axis
be reversed.
specifies a line type for reference lines specified
by the AUTOHREF option.
specifies line types for reference lines originating
on the horizontal axis.
specifies a line width for reference lines specified
by the AUTOHREF option.
specifies a line width for reference lines specified
by the HREF= option.
specifies the number of major tick marks on the
horizontal x axis.
Labeling option
labels the contour lines.
Vertical axis options
displays reference lines originating at the major
tick marks on the vertical axis.
specifies a color for all the reference lines displayed
by the AUTOHREF option.
specifies a color for all the reference lines displayed
by the AUTOVREF option.
specifies a color or colors for reference lines
drawn with the VREF= option and the AUTOVREF option.
specifies a line type for reference lines specified
by the AUTOVREF option.
specifies line types for reference lines originating
on the vertical axis.
assigns axis characteristics from the corresponding
axis definition to the vertical y axis.
specifies the number of minor tick marks located
between each major tick mark on the vertical y axis.
displays up to 100 reference lines originating on
the vertical y axis at specified
values within the y axis
range.
specifies that the order of the values on the vertical
axis be reversed.
specifies a line width for reference lines specified
by the AUTOVREF option.
specifies a line width for reference lines specified
by the VREF= option.
specifies the number of major tick marks on the
vertical y axis.
Optional Arguments
Options in a PLOT statement affect all graphs that are produced by that statement. You can specify as many options as you want and list them in any order. If you use a BY statement on the procedure, the options in each PLOT statement affect all graphs produced by that BY statement.
- ANNOTATE= Annotate-data-set
- specifies an Annotate data set to enhance the charts produced by the PLOT statement.
- AUTOHREF
- displays reference lines originating at the major
tick marks on the horizontal axis. Restriction:Not supported by Java
- AUTOLABEL | AUTOLABEL=(autolabel_suboptions)
- labels the contour lines. Autolabel suboptions
enable you to control the appearance of these labels.The label for each contour line is the value of the z variable for that contour level. The labels are displayed in BEST format. The FORMAT statement enables you to change the display format.You can also use the SYMBOL statement to control the appearance and text of contour labels and lines.Restriction:Not supported by Java and ActiveX
- AUTOVREF
- displays reference lines originating at the major
tick marks on the vertical axis. Restriction:Not supported by Java
- CAUTOHREF=reference-line-color
- specifies a color for all the reference lines displayed
by the AUTOHREF option. The default color is
retrieved from the current style or from the device's color list if
the NOGSTYLE option is specified.Restriction:Not supported by Java
- CAUTOVREF=reference-line-color
- specifies a color for all the reference lines displayed
by the AUTOVREF option. The default color is
retrieved from the current style or from the device's color list if
the NOGSTYLE option is specifiedRestriction:Not supported by Java
- CAXIS=axis-color
- specifies a color for axis lines, axis tick marks,
and the frame around the plot. The default color is
retrieved from the current style or from the device's color list if
the NOGSTYLE option is specified.Restriction:Partially supported by Java
- CFRAME=background-color
- fills the axis area with the specified color. The default color is
retrieved from the current style or from the device's color list if
the NOGSTYLE option is specified.Alias:CFR=
- CHREF=reference-line-color | (reference-line-color) | (reference-line-color list)
- specifies a color or colors for reference lines
drawn with the HREF= option and the AUTOHREF option. Colors are specified
as follows: The default color is retrieved from the current style or from the device's color list if the NOGSTYLE option is specified.Alias:CH=Restriction:Not supported by Java
- CLEVELS=color(s)
- specifies a color or list of colors for the contour
levels. GCONTOUR substitutes
user-defined colors in the ODS style. If more colors are needed, GCONTOUR
uses the next color in the ODS style until all lines have an associated
color. The default color is retrieved from the current style or from
the device's color list if the NOGSTYLE option is specified.Restriction:Not supported by Java and partially supported by ActiveX
- COUTLINE=outline-color
- specifies a color for outlining filled areas. This option is ignored
unless the PATTERN option is also used. COUTLINE=SAME creates a plot
with outlines that are the same color as the adjacent fill color.Restriction:Not supported by Java and ActiveXNote:The outline color is the only distinction between empty patterns. Use of this option makes the patterns look the same when VALUE=EMPTY in PATTERN definitions.Example:Using Patterns and Joins
- CTEXT=text-color
- specifies a color for the axis labels, axis tick
mark values, legend labels, and legend value descriptions. GCONTOUR uses the first
color that it finds in the following list: The LEGEND statement's VALUE= color is used for legend values, and its LABEL= color is used for legend labels.The AXIS statement's VALUE= color is used for legend values, and its LABEL= color is used for legend labels. However, if the AXIS statement specifies only general axis colors with its COLOR= option, the CTEXT= color overrides the general COLOR= specification. In this case CTEXT= is used for axis labels and values. Meanwhile, the COLOR= color is still used for all other axis colors, such as tick marks.Note:If you use a BY statement in the procedure, the color of the BY variables' labels is controlled by the CBY= option in the GOPTIONS statement.Example:Using Patterns and Joins
- CVREF=reference-line-color | (reference-line-color) | (reference-line-color list)
- specifies a color or colors for reference lines
drawn with the VREF= option and the AUTOVREF option. Colors are specified
as follows: Alias:CV=Restriction:Not supported by Java
- DESCRIPTION=“description”
- specifies a description of the output. The maximum length
for description is 256 characters.
The description does not appear in the output. The descriptive text
is shown in each of the following: The description can include the #BYLINE, #BYVAL, and #BYVAR substitution options, which work as they do when used on TITLE, FOOTNOTE, and NOTE statements. Refer to Substituting BY Line Values in a Text String. The 256-character limit applies before the substitution takes place for these options. Thus, if in the SAS program the description text exceeds 256 characters, it is truncated to 256 characters, and then the substitution is performed.Alias:DES=Default:PLOT OF y*x=z, where y*x=z is the request specified in the PLOT statement.
- GRID
- draws reference lines at all major tick marks on
both axes. This option produces
the same result as would be achieved with specifying both the AUTOHREF
and AUTOVREF options.Restriction:Not supported by Java
- HAXIS=AXIS<1...99>
- assigns axis characteristics from the corresponding
axis definition to the horizontal x axis. If the AXIS statement
specifies the REFLABEL= option, labels are applied in sequence to
all reference lines generated with the HREF= option.Restriction:Partially supported by Java and ActiveXSee:AXIS Statement
- HMINOR=number-of-minor-tick marks
- specifies the number of minor tick marks to draw
between each major tick mark on the horizontal x axis. Alias:HM=Interaction:The HMINOR= option overrides the MINOR= option in an AXIS definition assigned to the horizontal axisExample:Specifying Contour Levels
- HREF=value | (value) | (value-list)
- displays up to 100 reference lines originating on
the horizontal x axis at
specified values within the x axis
range. Any values specified
beyond the axis range are not drawn, and a warning is issued to the
log. To specify labels for this option, use the HAXIS= option. The value-list can
be an explicit list of values, a starting value and an ending value
with an interval increment, or a combination of both forms:
Restriction:Not supported by Java
- HREVERSE
- specifies that the order of the values on the horizontal x axis
be reversed. Restriction:Not supported by Java
- JOIN
- combines adjacent grid cells with the same pattern
to form a single pattern area. Restriction:This option is ignored unless the PATTERN option is also used.Note:Java and ActiveX support the JOIN option without the pattern option.
- LAUTOHREF=reference-line-type
- specifies a line type for reference lines specified
by the AUTOHREF option. The reference-line-type value
is any integer from 1 to 46. A value of 1 specifies a solid line;
values 2 through 46 specify dashed lines. Default:1 (solid)Restriction:Not supported by JavaSee:Specifying Line Types for available line types
- LAUTOVREF=reference-line-type
- specifies a line type for reference lines specified
by the AUTOVREF option. The reference-line-type value
is any integer from 1 to 46. A value of 1 specifies a solid line;
values 2 through 46 specify dashed lines. Restriction:Not supported by JavaSee:Specifying Line Types for available line types
- LEGEND=LEGEND<1...99>
- assigns legend characteristics from the corresponding
legend definition to the plot's legend. To suppress the legend,
use the NOLEGEND option. The LEGEND= option is ignored if the specified
LEGEND definition is not currently in effect.Restriction:Partially supported by Java (always displayed on the right side of plot) and ActiveXInteraction:If you use the SHAPE= option in a LEGEND statement, the value LINE is valid. If you use the PATTERN option, SHAPE=BAR is also valid.See:LEGEND Statement
- LEVELS=value-list
- specifies up to 100 values for the z variable. Because GCONTOUR uses the z variable to calculate plot contour levels, you can use the LEVELS= option to change the number of contour levels plotted.
- LHREF=reference-line-type | (reference-line-type) | (reference-line-type list)
- specifies line types for reference lines originating
on the horizontal axis. The reference-line-type value
is any integer from 1 to 46. A value of 1 specifies a solid line;
values 2 through 46 specify dashed lines. When using this option,
the following is true: Alias:LH=Restriction:Not supported by Java and partially supported by ActiveXSee:Specifying Line Types for available line types
- LJOIN
- displays filled contour areas with contour lines. Restriction:Supported by Java and ActiveX only
- LLEVELS=line-type-list
- lists line types for plot contour lines. Each line type represents
one contour level. If fewer line types are specified than the number
of levels in the plot, GCONTOUR provides additional line types. Valid
values for line-type-list are
integers from 1 to 46. A value of 1 specifies a solid line; values
2 through 46 specify dashed lines.Default:1 (solid)Restriction:Not supported by Java and partially supported by ActiveXSee:Specifying Line Types for the line types represented by each number.Example:Specifying Contour Levels
- LVREF=reference-line-type | (reference-line-type) | (reference-line-type-list)
- specifies line types for reference lines originating
on the vertical axis. Valid values for line-type-list are
integers from 1 to 46. A value of 1 specifies a solid line; values
2 through 46 specify dashed lines. When using this option the following
is true: Alias:LV=Restriction:Partially supported by Java and ActiveXSee:Specifying Line Types for the line types represented by each number
- NAME=“name”
- specifies the name of the GRSEG catalog entry and
the name of the graphics output file, if one is created. The name can be up
to 256 characters long, but the GRSEG name is truncated to eight characters.
Uppercase characters are converted to lowercase. Periods are converted
to underscores. If you specify DEVICE=ACTIXIMG or DEVICE=JAVAIMG,
then the name that you specify is used for the graphics output file
even if the file exists. If the name duplicates an existing GRSEG
name, then
SAS/GRAPH
- NLEVELS=number-of-levels
- specifies the number of contour levels to plot. Valid values are integers
from 1 to 100.
If the value of NLEVELS= is less than 7, then the algorithm is as follows:
D = (Zmax - Zmin) / NLEVELS
d= 0.5 * D
L[0] = Zmin + d, L[i] = L[i-1] + D
In this algorithm, each level is the midpoint of a number of ranges equal to the value of the NLEVELS= option. These ranges exactly cover the range of the z variable.If the value of NLEVELS= is greater than or equal to 7, then the algorithm is as follows:e= 0.05 * (100 - NLEVELS) / 93 d = (Zmax - Zmin) * e D = ((Zmax - Zmin - 2*d) / (NLEVELS - 1) L[0] = Zmin + d, L[i] = L[i-1] + D
Default:20 for Java, 6 for ActiveX, 7 for all other devicesRestriction:Partially supported by Java and ActiveXExample:Specifying Contour Levels
- NOAXIS
- specifies that a plot have no axis values, axis
labels, or axis tick marks. The frame is displayed
around the plot unless you use the NOFRAME option.Alias:NOAXESRestriction:Partially supported by Java
- NOLEGEND
- suppresses the legend that describes the plot by
displaying the z variable
name or label, the legend values, and legend value descriptions. Default:LEGEND
- PATTERN
- specifies that the plot contour levels are represented
by rectangles filled with patterns. The pattern for each
rectangle is determined by calculating the mean of the values of the z variable
for the four corners of the rectangle. The pattern is then assigned
for the level closest to the mean.
Example:Using Patterns and Joins
- SMOOTH
- produces smooth gradient areas between levels. Restriction:Supported by Java and ActiveX only
- VAXIS=AXIS<1...99>
- assigns axis characteristics from the corresponding
axis definition to the vertical y axis. If the AXIS statement
specifies the REFLABEL= option, labels are applied in sequence to
all reference lines generated with the VREF= option.Restriction:Partially supported by Java and ActiveXSee:AXIS StatementExample:Specifying Contour Levels
- VMINOR=number-of-minor-tick marks
- specifies the number of minor tick marks located
between each major tick mark on the vertical y axis. Value labels are not
displayed for minor tick marks.Alias:VM=Interaction:The VMINOR= option overrides the MINOR= option in an AXIS definition that is assigned to the vertical axis.Example:Specifying Contour Levels
- VREF=value | (value) | (value-list)
- displays up to 100 reference lines originating on
the vertical y axis at specified
values within the y axis
range. Any values specified
beyond the axis range are not drawn, and a warning is issued to the
log. To specify labels for these reference lines, use the VAXIS= option.
The value-list can be an explicit
list of values, a starting value and an ending value with an interval
increment, or a combination of both forms:
Restriction:Not supported by Java
- VREVERSE
- specifies that the order of the values on the vertical
axis be reversed. Restriction:Not supported by Java
- WAUTOHREF=reference-line-width
- specifies a line width for reference lines specified
by the AUTOHREF option. The reference-line-width can
be any number greater than zero, and does not need to be an integer.
If you specify a value that is less than zero, an error message is
output to the SAS log.Default:Current style setting, 1 if NOGSTYLERestriction:Not supported by Java and ActiveX
- WAUTOVREF=reference-line-width
- specifies a line width for reference lines specified
by the AUTOVREF option. The reference-line-width can
be any number greater than zero, and does not need to be an integer.
If you specify a value that is less than zero, an error message is
output to the SAS log.Default:Current style setting, 1 if NOGSTYLERestriction:Not supported by Java and ActiveX
- WHREF=reference-line-width | (reference-line-width) | (reference-line-width-list)
- specifies a line width for reference lines specified
by the HREF= option. The reference-line-width can
be any integer that is greater than zero. If you specify a value that
is less than zero or is not an integer value, an error message is
output to the SAS log. Specifying a line width without parentheses
applies that type to all reference lines drawn with the WAUTOHREF
and HREF= options. Note that the WAUTOHREF= option overrides WHREF=reference-line-width for
reference lines drawn with the WAUTOHREF option. Specifying a single
line width in parentheses applies that line width to the first reference
line drawn with the HREF= option. Specifying a line width list applies
line widths in sequence to successive reference lines drawn with the
HREF= option. The syntax of the line-width list requires parentheses
and the line widths separated by spaces (width1 width2 ...widthN).
The default line width is specified by the current style or by the
AXIS statement's WIDTH= option. (By default, WIDTH=1.). To specify
colors for these reference lines, use the CHREF= option.Default:Current style setting, 1 if NOGSTYLERestriction:Not supported by Java and ActiveX
- WVREF=reference-line-width | (reference-line-width) | (reference-line-width-list)
- specifies a line width for reference lines specified
by the VREF= option. The reference-line-width can
be any integer that is greater than zero. If you specify a value that
is less than zero or is not an integer value, an error message is
output to the SAS log. Specifying a line width without parentheses
applies that type to all reference lines drawn with the WAUTOVREF
and VREF= options. Note that the WAUTOVREF= option overrides WVREF=reference-line-width for
reference lines drawn with the WAUTOVREF option. Specifying a single
line width in parentheses applies that line width to the first reference
line drawn with the VREF= option. Specifying a line width list applies
line widths in sequence to successive reference lines drawn with the
HVEF= option. The syntax of the line-width list requires parentheses
and the line widths separated by spaces (width1 width2 ...widthN).
The default line width is specified by the current style or by the
AXIS statement's WIDTH= option. (By default, WIDTH=1.). To specify
colors for these reference lines, use the CVREF= option.Default:Current style setting, 1 if NOGSTYLERestriction:Not supported by Java and ActiveX
- XTICKNUM=number-of-major-tick-marks
- specifies the number of major tick marks on the horizontal x axis. The value of number-of-major-tick–marks must be greater than or equal to 2. The MAJOR= and ORDER= options in an AXIS definition that is assigned to the horizontal x axis overrides the XTICKNUM= option.
- YTICKNUM= number-of-major-tick-marks
- specifies the number of major tick marks on the vertical y axis. The value of number-of-major-tick-marks must be greater than or equal to 2. The MAJOR= and ORDER= options in an AXIS definition that is assigned to the vertical y axis overrides the YTICKNUM= option.
AUTOLABEL= Suboptions
The AUTOLABEL= option accepts the following autolabel suboptions:
- CHECK=checking-factor | NONE
-
specifies a collision checking factor that controls collisions between contour label text and other contour lines or other labels. Values can be integers from 0 to 100, inclusive, where 0 provides minimal collision checking and 100 provides maximal collision checking. Fractional values are permitted.CHECK=NONE suppresses contour label collision checking and can lessen the time needed to compute the contour plot.Default:75
- MAXHIDE=amount <units>
-
specifies the maximum amount of the contour line that can be hidden by contour labels. The value of amount must be greater than zero.Valid units are CELLS (horizontal character cell positions), CM (centimeters), IN (inches), or PCT (percentage of the width of the graphics output area). If you omit units, a unit specification is searched for in this order:
-
the GUNIT= option in a GOPTIONS statement
-
the default unit, CELLS
For units that you specify as PCT or CELLS, the MAXHIDE= suboption calculates the amount of contour line that can be hidden based on the width of the graphics output area. For example, suppose you specify MAXHIDE=50 PCT and the graphics output area is 9 inches wide. Then the maximum amount of the contour line that can be hidden by labels is 4.5 inches.This option maintains data integrity. It provides a check for overly small increments in the STEP= option in the SYMBOL statement. Moreover, the MAXHIDE= option can prevent small contours from being significantly hidden even when the value of the STEP= option is sufficiently large.Default:MAXHIDE=100 -
- REVEAL
-
specifies that the contour lines are visible through the label text as dashed lines. Line style 33 is used. This option provides a simple way to see all portions of labeled contours, and can be used to inspect the label positions with respect to the contour lines. The REVEAL option is primarily used for debugging. Occasionally, single-character contour labels can be placed off center from the clipped portion of the contour line when the contour line is irregular or jagged.
Details
Description
The PLOT statement specifies
the three variables to plot. It can also control the contour levels,
label the plot lines, and modify the axes as well as the general appearance
of the graph. Only one plot request can be specified in a PLOT statement.
To specify multiple
plots for a single PROC GCONTOUR statement, use multiple PLOT statements.
If a global statement is specified more than once, the last occurrence
is applied to all PLOT statements in that PROC step.
Global statements enable
you to modify the axes, the legend, the contour lines and contour
line labels, the fill patterns and pattern colors for contour areas.
You can also add titles, footnotes, and notes to the plot. You can
use an Annotate data set and set GOPTIONS to enhance the appearance
of the plot. Moreover, you can filter your data with a WHERE clause.
You can format your data values and add labels to the variables. You
can generate multiple plots with a BY statement or multiple plot statements.
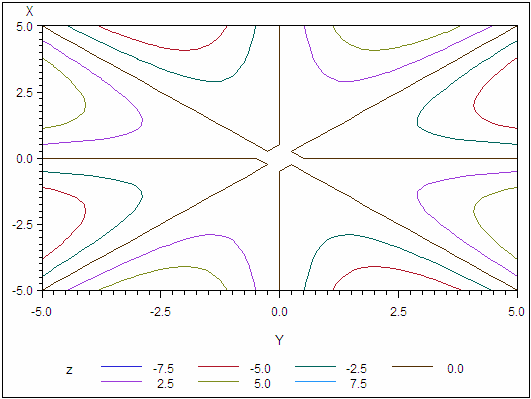
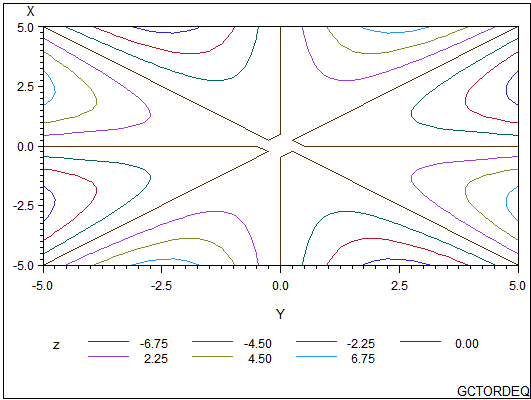
Selecting Contour Levels
The LEVELS= option represents
the z variable values as a
third dimension, using uniquely colored contour lines.
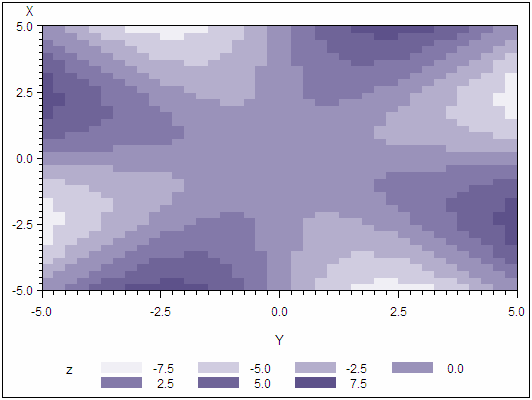
Using the PATTERN option
with the LEVELS= option generates a plot with contour levels that
are displayed as solid filled rectangles. The rectangles are formed
by points in the (x, y) grid.
The contour pattern of a rectangle, or grid cell, is determined by
average value of the z variable
for the four corners of the rectangle. The grid cell is assigned the
pattern for the level closest to the calculated mean. For example,
suppose you have specified contour levels of 0, 5, and 10, and the
plot contains a grid cell with a mean of 100. The grid cell is assigned
the pattern for the nearest level: 10. A grid cell with a mean of
7.6 is also assigned the pattern for the 10 level. The same data used
with the following PLOT statement in the GCONTOUR procedure produces
a similar contour plot:
plot y*x=z / levels=-7.5 to 7.5 by 2.5/
      pattern;
run;
The following contour
plot with the PATTERN option uses the same data and contour levels
as Using Patterns and Joins. Contour plots using the same contour levels can present
your data differently, if one plot uses a pattern and the other does
not. However, the contour pattern boundaries in the following contour
plot do not correspond to the contour lines shown in the example.
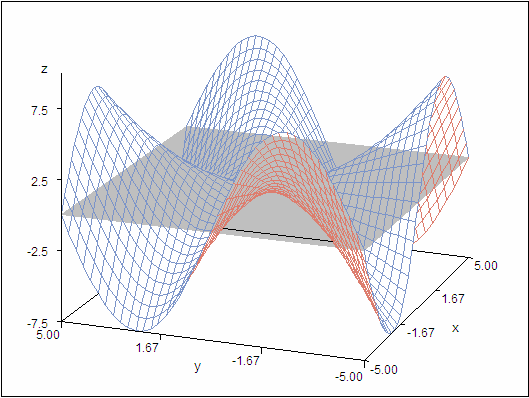
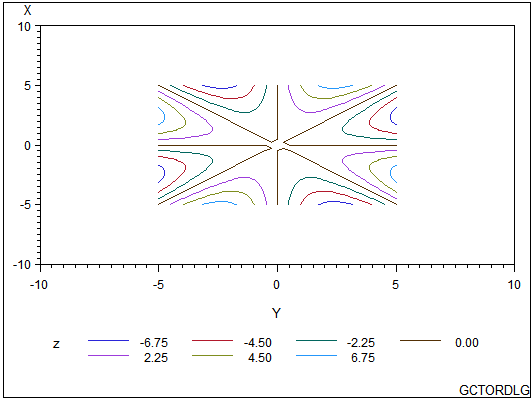
Using the data to create
a surface plot with the G3D procedure, the contour lines in a GCONTOUR
procedure plot represent the intersection of the plane and the surface.
For example, suppose
that you use the G3D procedure, and your data produces a surface plot
like the one shown below.
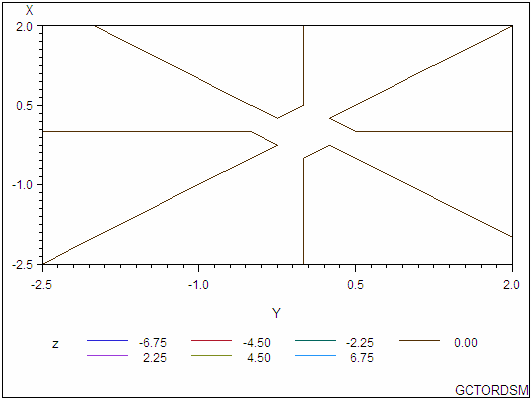
Specifying Axis Order
You can use AXIS statements
to modify the text and appearance of plot axes. You can then assign
the axes to the contour plot with the PLOT statement's HAXIS= and
VAXIS= options. If the AXIS statement uses an ORDER= option, there
are special considerations for using that AXIS definition with the
GCONTOUR procedure.
A list of variable values
that are specified with the AXIS statement's ORDER= option must contain
numbers listed in ascending or descending order. These numbers are
treated as a continuous data range for an axis. Thus, for a contour
line or pattern to span the entire specified range, it is not necessary
for the maximum and minimum values of the list to match exactly with
the maximum and minimum data values of the corresponding x or y variable.
For example, suppose that you assign this AXIS definition to the horizontal
(x) axis:
axis1 order=-2.5 to 2.5 by .5
Suppose also that the
horizontal axis variable has these values: –5, –4, –3,
–2, –1, 0, 1, 2, 3, 4, 5. Depending on the data, contours
could extend through the full range of the ORDER= list rather than
from –2 to 2. –2 to 2 are the actual values of the variable
assigned to the horizontal (x)
axis. In this case, values are interpolated for the x variable
at any point where the y variable
intersects the minimum axis value (–2.5) or the maximum axis
value (2.5). Data values that are outside of the axis range (in this
case, –5, –4, –3, 3, 4, and 5) are clipped from
the plot.
Modifying Contour Lines and Labels with the SYMBOL Statement
Controlling Line and Label Attributes
When you use the AUTOLABEL
option, the LLEVELS= and CLEVELS= options are ignored, and contour-line
and label attributes are controlled by the SYMBOL statement. Defaults
are used if not enough SYMBOL statements are specified to match the
number of contour levels.
If a SYMBOL statement
does not include a color option, the SYMBOL statement can be applied
to more than one contour level. In this case, the SYMBOL statement
is used once with every color in the color list and generates more
than one SYMBOL definition. See the SYMBOL Statement for details.
The Effect of SYMBOL Statement Options on Contour Lines and Labels describes how
SYMBOL statement options affect contour plot lines and labels.
The STEP= option specifies
the minimum distance between contour labels. The lower the value,
the more labels the procedure uses. A STEP= value of less than 10%
is ignored by the GCONTOUR procedure and a value of 10% is substituted.
For more information,
see the SYMBOL Statement.
Specifying Text for Contour Labels
To override the default
labels that are displayed by the AUTOLABEL option, you can specify
label text for one or more contour lines. To do so, use both the FONT=
and VALUE= options in the SYMBOL statement that is assigned to the
contour level. Default labels are used for contour levels that you
do not label.
For example, this SYMBOL1
statement displays the text string
DEEP in
the Arial font on the contour line that it modifies: symbol1 font="Arial Rounded MT Bold" value="DEEP";
You must specify both
FONT= and VALUE= options or the text is not used. For an example, see Labeling Contour Lines, Modifying the Horizontal Axis, Modifying the Legend.