GCHART Procedure
- Syntax

- Overview
- Concepts
- Examples Specifying the Sum Statistic in a Block ChartGrouping and Subgrouping a Block ChartSpecifying the Sum Statistic in Bar ChartsSubgrouping a Three-Dimensional Vertical Bar ChartControlling Midpoints and Statistics in a Horizontal Bar ChartGenerating Error Bars in a Horizontal Bar ChartSpecifying the Sum Statistic for a Pie ChartSubgrouping a Donut or Pie ChartOrdering and Labeling Slices in a Pie ChartGrouping and Arranging Pie ChartsSpecifying the Sum Statistic in a Star ChartCharting a Discrete Numeric Variable in a Star ChartCreating a Detail Pie Chart
- References
Example 8: Subgrouping a Donut or Pie Chart
| Features: |
DONUT statement options DONUTPCT=, LABEL=, LEGEND=, NOHEADING, and SUBGROUP= |
| Other features: |
GOPTIONS statement option BORDER and LEGEND statement |
| Sample library member: | GCHSBGRP |
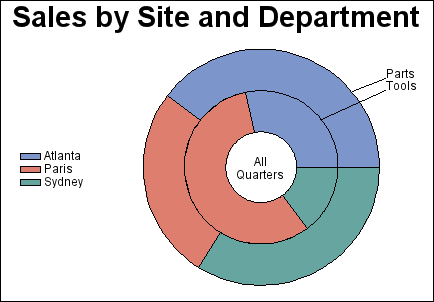
This example produces
a donut chart that is similar to the pie chart in Specifying the Sum Statistic for a Pie Chart. The similarity is that each slice represents total sales
for a site and each slice is a different color. However, in this donut
chart the sites are subgrouped by department, so that each department
is represented as a concentric ring with slices.
Subgrouping suppresses
the chart statistic and the midpoint labels. Instead, it automatically
labels the rings with the subgroup values and generates a legend that
shows how the patterns are associated with the midpoint values. Subgrouping
a pie chart produces the same results but without the hole in the
center.
To make the donut chart
as large as possible, the program suppresses the default heading and
moves the legend into the space at the left of the chart.
Program
goptions reset=all border;
data totals;
length dept $ 7 site $ 8;
input dept site quarter sales;
datalines;
Parts Sydney 1 7043.97
Parts Atlanta 1 8225.26
Parts Paris 1 5543.97
Tools Sydney 4 1775.74
Tools Atlanta 4 3424.19
Tools Paris 4 6914.25
;
title "Sales by Site and Department";
legend1 label=none
position=(middle left)
offset=(5,)
across=1;
proc gchart data=totals;
format sales dollar8.;
donut site / sumvar=sales
subgroup=dept
donutpct=30
label=("All" justify=center "Quarters")
noheading
legend=legend1;
run;
quit;
Program Description
Set the graphics environment. The
BORDER option in the GOPTIONS statement draws a black border around
the graph.
Create data set TOTALS. TOTALS
contains quarterly sales data for three manufacturing sites for one
year. Sales figures are broken down by department.
data totals;
length dept $ 7 site $ 8;
input dept site quarter sales;
datalines;
Parts Sydney 1 7043.97
Parts Atlanta 1 8225.26
Parts Paris 1 5543.97
Tools Sydney 4 1775.74
Tools Atlanta 4 3424.19
Tools Paris 4 6914.25
;
Modify the subgroup legend. The
LABEL= option suppresses the legend label. The POSITION=, the OFFSET=,
and the ACROSS= options arrange the legend entries in a column to
the left of the pie chart.
Produce the donut chart. The
SUBGROUP= option divides the donut into rings. Each ring represents
a value of the subgroup variable, DEPT. The DONUTPCT= option controls
the size of the donut hole, which contains the text specified by the
LABEL= option. The NOHEADING option suppresses the default heading
that contains the name of the chart variable and the type of statistic.
The LEGEND= option assigns the LEGEND1 statement to the chart.