
Visualization & Reporting
SAS Visual Analytics
Now everyone can easily discover and share powerful insights that inspire action.
A single application for reporting, data exploration and analytics.

See the big picture – and underlying connections.
Quickly spot important relationships in your data using suggestions and clearly identified related measures. Use machine learning and natural language explanations to find, visualize and narrate stories and insights that are easy to understand and explain. Find out why something happened, examine all options and uncover opportunities hidden deep in your data. Automatically highlight key relationships, outliers, clusters and more to reveal vital insights that inspire action.
Turn seeing into understanding with dynamic visuals.
Create stunning interactive reports and dashboards. Quickly summarize key performance metrics and share them via the web and mobile devices. Executives and front-line staff can quickly interact with and collaborate on insights, slice and dice them to find their own answers, and better understand business performance.


Get answers backed by data, results driven by insight.
Easy-to-use predictive analytics enables even business analysts to assess possible outcomes and make smarter, data-driven decisions – no programming required. Smart algorithms reduce the need for manual experimentation. And you can work collaboratively with experts to focus on what’s most relevant.
Add the 'where' to the 'what.'
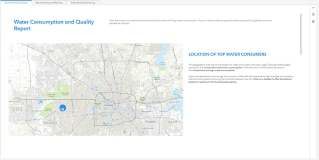
Add geographical context to your analyses and visualizations by combining traditional data with location data. Location analysis brings the “where” dimension to the forefront so you can analyze data in new ways to get the full picture before making decisions while identifying location-specific opportunities.


Streamline the discovery process.
Self-service data preparation gives business users the ability to import their own data, join tables, apply data quality functions, create calculated columns and more – all with drag-and-drop ease. By empowering users to access, combine, clean and prepare their own data in an agile – and trusted – way, SAS Visual Analytics facilitates faster, broader adoption of analytics for your entire organization.
Leverage the best of both platforms.
Use Microsoft productivity tools from Microsoft 365 for seamless access to analytics from SAS. Drill down into your data, access and interact with reports in SAS Visual Analytics and embed insights in your Microsoft applications like Excel and Outlook. Then share them with your closest collaborators.


Key Features
Interactive reporting. Visual discovery. Self-service analytics. Scalability and governance. All from a single, powerful in-memory environment.
Embedded insights
Embed individual visual insights from SAS Visual Analytics reports, build interactive stories or embed the whole interactive report or page into your custom web applications. Publish your insights that scale with the flexibility of live data or embedded data snapshots for data storytelling.
SAS Visual Analytics Apps for mobile devices
Use native mobile apps for iOS and Android to view and interact with others through dynamic reports and dashboards on tablets and smartphones.
Open integration for developers
Add creative visualization with third-party JavaScript libraries, such as D3 and C3, with full interactivity within SAS Visual Analytics. Leverage open source development resources for developers and REST APIs for any client language to access SAS analytics, data and services.

Интерактивные демо
Ознакомьтесь с этими интерактивными демонстрационными примерами SAS Visual Analytics, чтобы узнать, как быстро и просто вы можете исследовать и понимать данные для решения различных отраслевых и бизнес-задач.
-
 UTILITIES
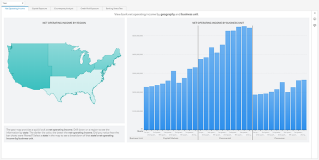
Water Consumption & QualityMonitor the quality and consumption of this critical natural resource.
UTILITIES
Water Consumption & QualityMonitor the quality and consumption of this critical natural resource.
-
 BANKING
Banking & Risk InsightsGet a holistic view of risk and performance across regions, down to the individual counterparty level.
BANKING
Banking & Risk InsightsGet a holistic view of risk and performance across regions, down to the individual counterparty level.
-
 RETAIL & CONSUMER GOODS
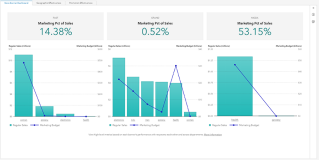
Retail InsightsAnalyze regional store performance, and make data-driven decisions about retail business functions.
RETAIL & CONSUMER GOODS
Retail InsightsAnalyze regional store performance, and make data-driven decisions about retail business functions.
-
 MANUFACTURING
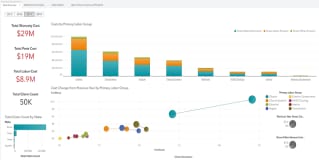
Warranty AnalysisAnalyze warranty claims to quickly identify potential issues and their underlying causes.
MANUFACTURING
Warranty AnalysisAnalyze warranty claims to quickly identify potential issues and their underlying causes.
-
 PUBLIC HEALTH
Emerging Disease Surveillance & ForecastingCreate an automated, insightful and transparent surveillance program for use in detecting new disease activity and tracking seasonal diseases.
PUBLIC HEALTH
Emerging Disease Surveillance & ForecastingCreate an automated, insightful and transparent surveillance program for use in detecting new disease activity and tracking seasonal diseases.
SAS Viya is cloud-native and cloud-agnostic
Consume SAS how you want – SAS managed or self-managed. And where you want.


Узнайте больше о SAS ® Visual Analytics и не только
Для просмотра ресурсов по типу выберите один из вариантов ниже.
-
- Выберите тип ресурса
- Аналитический отчет
- Технический документ
- Технический документ
- Вебинар
- Article
- Blog Post
- Book Excerpt
- Case Study
- Customer Story
- E-Book
- Infographic
- Interview
- Research
- Series
- Video
-
 E-Book
Augmented Analytics: The secret ingredient to better business intelligenceAugmented analytics breaks down the limitations of
business intelligence (BI) and brings forward insights
from data using AI and machine learning.
E-Book
Augmented Analytics: The secret ingredient to better business intelligenceAugmented analytics breaks down the limitations of
business intelligence (BI) and brings forward insights
from data using AI and machine learning.
-
 Технический документ
The Use of Open Source is Growing. So Why Do Organizations Still Turn to SAS?This conclusions paper summarizes a session at the 2014 Hadoop Summit presented by Brian Garrett, Principal Solutions Architect at SAS Institute Inc. titled, “With the Rise of Open Source, Why Organizations Still Turn to SAS.” In it, he explains why corporate analytics requirements are best served when companies run both SAS enterprise-class analytics solutions and open source solutions together. Garrett explains how these technologies meet different needs and co-exist well. He also highlights recent SAS software enhancements that allow analysts to incorporate R algorithms into analytic processes as part of a comprehensive, enterprise-class SAS analytics platform.
Технический документ
The Use of Open Source is Growing. So Why Do Organizations Still Turn to SAS?This conclusions paper summarizes a session at the 2014 Hadoop Summit presented by Brian Garrett, Principal Solutions Architect at SAS Institute Inc. titled, “With the Rise of Open Source, Why Organizations Still Turn to SAS.” In it, he explains why corporate analytics requirements are best served when companies run both SAS enterprise-class analytics solutions and open source solutions together. Garrett explains how these technologies meet different needs and co-exist well. He also highlights recent SAS software enhancements that allow analysts to incorporate R algorithms into analytic processes as part of a comprehensive, enterprise-class SAS analytics platform.
-
 Технический документ
Workforce AnalyticsThis paper explores how government HR functions can use advanced analytics, machine learning and AI to develop effective plans to meet hiring, retention and performance goals.
Технический документ
Workforce AnalyticsThis paper explores how government HR functions can use advanced analytics, machine learning and AI to develop effective plans to meet hiring, retention and performance goals.
-
 Customer Story
«Первое кредитное бюро» предложило новую услугу на базе инструментов аналитики SAS и облачной платформы StatCloudОблачная интерактивная среда, построенная на решениях компании SAS, позволяет клиентам Бюро анализировать свой портфель и видеть свои позиции относительно остального финансового рынка.
Customer Story
«Первое кредитное бюро» предложило новую услугу на базе инструментов аналитики SAS и облачной платформы StatCloudОблачная интерактивная среда, построенная на решениях компании SAS, позволяет клиентам Бюро анализировать свой портфель и видеть свои позиции относительно остального финансового рынка.
-
 Технический документ
Fast and FuriousWhite paper for IT that explains the components and deployment options for SAS Visual Analytics.
Технический документ
Fast and FuriousWhite paper for IT that explains the components and deployment options for SAS Visual Analytics.
-
 Технический документ
Building an Analytical Culture for SuccessAn ambitious, culture-centric project reshaped people’s attitudes about data and quickly returned more than a $1 million in cost savings. See the six guiding principles that led to success where three earlier attempts had failed.
Технический документ
Building an Analytical Culture for SuccessAn ambitious, culture-centric project reshaped people’s attitudes about data and quickly returned more than a $1 million in cost savings. See the six guiding principles that led to success where three earlier attempts had failed.
-
 Customer Story
Building supplier nails inventory managementTravis Perkins uses supply chain analytics from SAS to optimize inventory across its 2,000 stores.
Customer Story
Building supplier nails inventory managementTravis Perkins uses supply chain analytics from SAS to optimize inventory across its 2,000 stores.
-
 Customer Story
Using artificial intelligence to decode dance patterns of beesAmesto NextBridge and Beefutures use visual analytics and machine learning to help protect and support healthy bee populations.
Customer Story
Using artificial intelligence to decode dance patterns of beesAmesto NextBridge and Beefutures use visual analytics and machine learning to help protect and support healthy bee populations.
-
 Customer Story
Zeroing in on property values with machine learningArtificial intelligence improves assessment accuracy and productivity in Wake County.
Customer Story
Zeroing in on property values with machine learningArtificial intelligence improves assessment accuracy and productivity in Wake County.
-
 Interview
Геолокационная аналитика: почему ответ на вопрос «где» выводит бизнес-аналитику на новый уровеньАнализ местоположения позволяет учитывать географические данные в бизнес-аналитике (BI), чтобы находить взаимосвязи между людьми, событиями, транзакциями, объектами и активами.
Interview
Геолокационная аналитика: почему ответ на вопрос «где» выводит бизнес-аналитику на новый уровеньАнализ местоположения позволяет учитывать географические данные в бизнес-аналитике (BI), чтобы находить взаимосвязи между людьми, событиями, транзакциями, объектами и активами.
-
 Технический документ
TDWI Checklist Report: Gaining Business Value from Governed Analytics and Discoverydata governance
Технический документ
TDWI Checklist Report: Gaining Business Value from Governed Analytics and Discoverydata governance
-
 Customer Story
Поиск лучших клиентов с помощью аналитикиSeacoast Bank enhances customer value using AI and SAS Visual Analytics on SAS Viya.
Customer Story
Поиск лучших клиентов с помощью аналитикиSeacoast Bank enhances customer value using AI and SAS Visual Analytics on SAS Viya.
-
 Customer Story
Автоматизированные лаборатории увеличивают работоспособность с помощью аналитикиПредиктивное и техническое обслуживание позволяют своевременно проводить лабораторные испытания Siemens Healthineers.
Customer Story
Автоматизированные лаборатории увеличивают работоспособность с помощью аналитикиПредиктивное и техническое обслуживание позволяют своевременно проводить лабораторные испытания Siemens Healthineers.
-
 Customer Story
Digital retailer bags record sales with analyticsShop Direct delivers award-winning, personalized customer experiences with SAS.
Customer Story
Digital retailer bags record sales with analyticsShop Direct delivers award-winning, personalized customer experiences with SAS.
-
 Customer Story
Artificial intelligence and IoT analytics keep aircraft operational for crucial missionsLockheed Martin revolutionizes aircraft maintenance with the SAS Platform.
Customer Story
Artificial intelligence and IoT analytics keep aircraft operational for crucial missionsLockheed Martin revolutionizes aircraft maintenance with the SAS Platform.
-
 Технический документ
Data Visualization TechniquesA picture is worth a thousand words – especially when you are trying to find relationships and understand your data – which could include thousands or even millions of variables. This paper takes you from the basics of charts and graphs to visualizing big data using SAS Visual Analytics.
Технический документ
Data Visualization TechniquesA picture is worth a thousand words – especially when you are trying to find relationships and understand your data – which could include thousands or even millions of variables. This paper takes you from the basics of charts and graphs to visualizing big data using SAS Visual Analytics.
-
 Customer Story
Как обеспечить безопасность пациентов с психическими расстройствами во время пандемии?SAS delivers dashboard to monitor COVID-19 in the Copenhagen Regional Psychiatric Centers.
Customer Story
Как обеспечить безопасность пациентов с психическими расстройствами во время пандемии?SAS delivers dashboard to monitor COVID-19 in the Copenhagen Regional Psychiatric Centers.
-
 Customer Story
Norway’s largest telecommunications, media and technology provider adapts to rapidly changing customer expectations using a hybrid cloud approachTelenor relies on SAS Viya on Azure and SAS Customer Intelligence 360 to provide fast, personalized customer service based on real-time analytics.
Customer Story
Norway’s largest telecommunications, media and technology provider adapts to rapidly changing customer expectations using a hybrid cloud approachTelenor relies on SAS Viya on Azure and SAS Customer Intelligence 360 to provide fast, personalized customer service based on real-time analytics.
-
 E-Book
Improving Customer ExperienceEveryone makes better decisions with easy access to powerful, interactive analytics – no matter the size of the business. This e-book profiles seven organizations that are using self-service data visualization and exploration to make big improvements in the way they work.
E-Book
Improving Customer ExperienceEveryone makes better decisions with easy access to powerful, interactive analytics – no matter the size of the business. This e-book profiles seven organizations that are using self-service data visualization and exploration to make big improvements in the way they work.
-
 Технический документ
The Power of CollaborationThis white paper explains the need for and value of the collaboration and self-service capabilities that SAS Visual Analytics and SAS Office Analytics provide. It provides how-to specifics for incorporating SAS Visual Analytics results with Microsoft Outlook, Excel, PowerPoint, Word and SharePoint with plenty of screen shots, explanations and architecture diagrams for IT.
Технический документ
The Power of CollaborationThis white paper explains the need for and value of the collaboration and self-service capabilities that SAS Visual Analytics and SAS Office Analytics provide. It provides how-to specifics for incorporating SAS Visual Analytics results with Microsoft Outlook, Excel, PowerPoint, Word and SharePoint with plenty of screen shots, explanations and architecture diagrams for IT.
-
 Технический документ
Redefine Your Analytics Journey With Interactive Data Exploration and Predictive AnalyticsWhat if your analytics journey were easier? It can be, in five easy steps. Learn how SAS Visual Analytics and SAS Visual Statistics together can provide a fast, fun way to explore data, build models and find the best performer.
Технический документ
Redefine Your Analytics Journey With Interactive Data Exploration and Predictive AnalyticsWhat if your analytics journey were easier? It can be, in five easy steps. Learn how SAS Visual Analytics and SAS Visual Statistics together can provide a fast, fun way to explore data, build models and find the best performer.
-
 Технический документ
Tar Heels Play to Win With SAS Analytics Learn how Carolina Athletics and its fundraising arm, The Rams Club, use SAS Analytics to deepen existing relationships and broaden a longstanding tradition of loyalty to all 28 of their university sports.
Технический документ
Tar Heels Play to Win With SAS Analytics Learn how Carolina Athletics and its fundraising arm, The Rams Club, use SAS Analytics to deepen existing relationships and broaden a longstanding tradition of loyalty to all 28 of their university sports.
-
 Вебинар
Оценка эффективности моделейНа данном вебинаре мы расскажем об аналитическом подходе к тарификации КАСКО на основе комплекса моделей машинного обучения. А также покажем, как с помощью SAS Visual Analytics можно представить результаты моделирования и бизнес-ограничения в интерактивном режиме.
Вебинар
Оценка эффективности моделейНа данном вебинаре мы расскажем об аналитическом подходе к тарификации КАСКО на основе комплекса моделей машинного обучения. А также покажем, как с помощью SAS Visual Analytics можно представить результаты моделирования и бизнес-ограничения в интерактивном режиме.
-
 Customer Story
Making faster, better lending decisionsLocal Government Federal Credit Union sees efficiency gains with SAS.
Customer Story
Making faster, better lending decisionsLocal Government Federal Credit Union sees efficiency gains with SAS.
-
 Customer Story
University aces data strategy to retain more studentsBetter student outcomes, million-dollar savings just the beginning for the University of North Texas.
Customer Story
University aces data strategy to retain more studentsBetter student outcomes, million-dollar savings just the beginning for the University of North Texas.
Сопутствующие продукты
Ознакомьтесь с продуктами, связанными с SAS Visual Analytics, построенными на SAS Platform.
- SAS® for Microsoft 365Get seamless access to analytical insights by using Microsoft 365 applications alongside SAS Viya.
- SAS® Visual ForecastingРешайте стоящие перед компанией задачи планирования с помощью системы, которая автоматически составляет масштабные иерархические прогнозы, поддерживает SAS и открытые языки программирования в рамках одной среды.
- SAS® Visual InvestigatorРешайте самые разные задачи интеллектуального анализа и управления исследованиями с помощью технологий углубленного анализа и машинного обучения в единой облачной аналитической среде.
- SAS® Visual StatisticsВ этой системе множество пользователей могут исследовать данные, а затем создавать и уточнять описательные и прогнозные модели в интерактивном режиме.