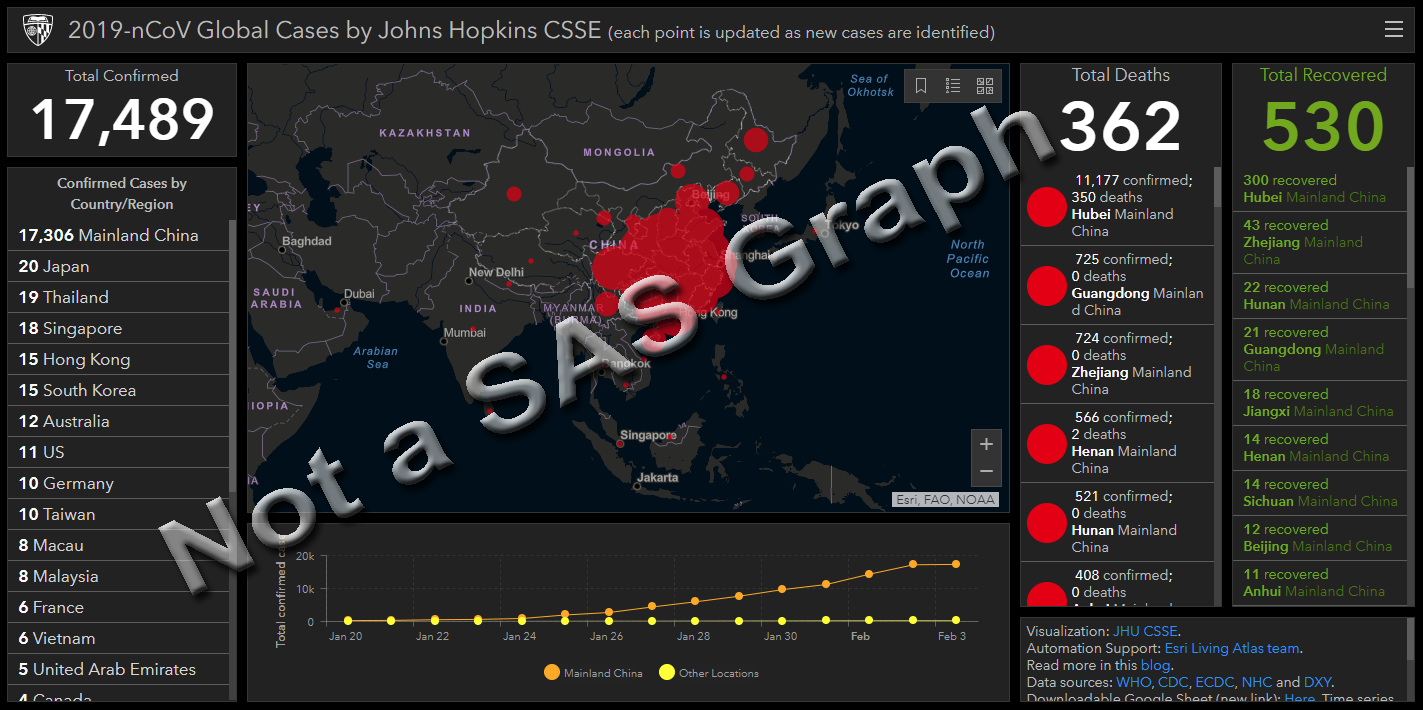
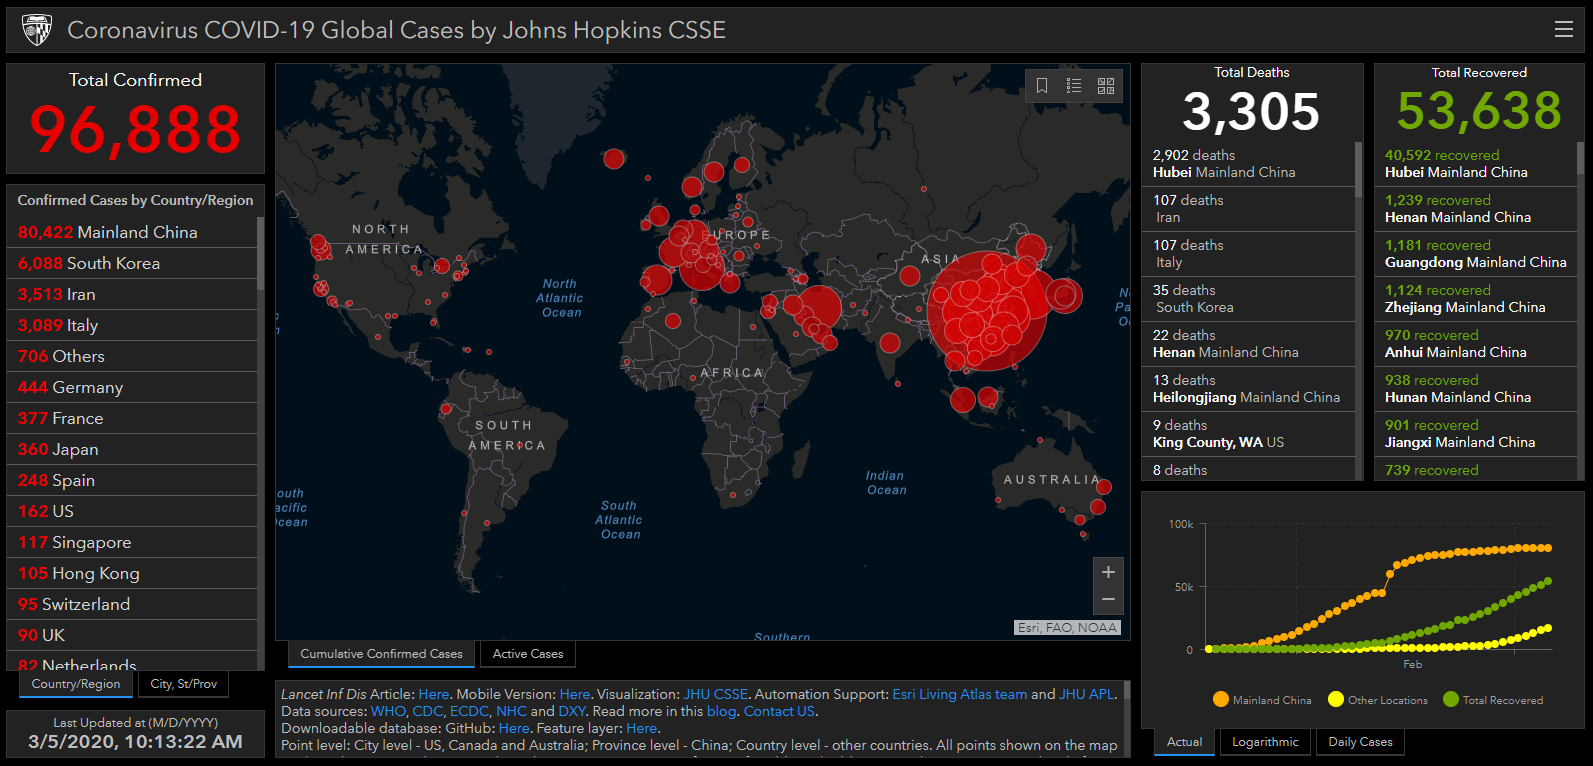
The COVID-19 Coronavirus outbreak has been in the news a lot lately, and everyone is probably looking for a quick/easy way to see the data. The best visualization I've seen so far is this dashboard by Johns Hopkins. Here's a screen-capture:
But before we dive into the data analysis, let's take a fun little tangent. Here is a picture my friend Yana created as her Stay at Home response - it's inspired by an American Coronet Magazine cover from 1954. She's clever and talented, eh?!? Check out her website to see more of her clever artwork!

To Make the Best Better
When I was growing up, I was in the 4-H club. Our motto was "To make the best better" ... and I guess that stuck with me. I even apply that motto to graphs! Therefore, I decided to see what I could do to improve Johns Hopkins' dashboard. My goal was to make the dashboard easier to read and comprehend, while keeping the same look and layout as the original. Below are some of the problems I saw in the their dashboard:
Title
Let's start with the title at the top of the page:

- Even though they are updating the dashboard as new data comes in, I think it would be good to show some sort of date/timestamp in the title.
Map
The graphic occupying the most space in the dashboard is the map. It represents the number of confirmed coronavirus cases using red bubbles.
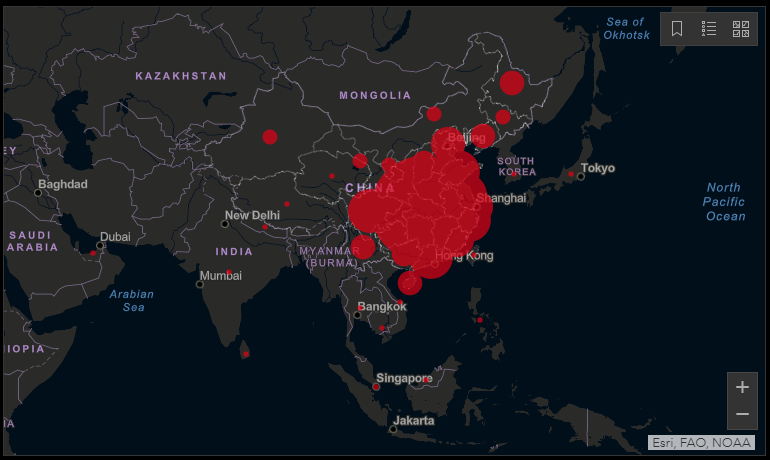

- The biggest problem with the map is that some of the bubbles represent countries, and some represent smaller geographical areas (such as provinces in China). While it might be interesting to see a bubble for the number of cases in the Guizhou province in China, it does not make good visual/graphical sense to compare that to the bubble for countries (such as the US) in the same map. I believe all the bubbles should represent the country level.
- Having the ability to pan and zoom the map is cool, but what I think most people would like to see is the whole world. And if you zoom out to see the whole world, the countries are very small, because there is a lot of wasted space around the edges (especially since the map includes Antarctica).
- Although you get a general feel for which countries have coronavirus, based on the position of the bubbles, it would be nice to see the affected countries shaded differently than the non-affected countries.
Total Confirmed Summary
To the left of the map is a summary count of the total number of confirmed cases, with a table below it.
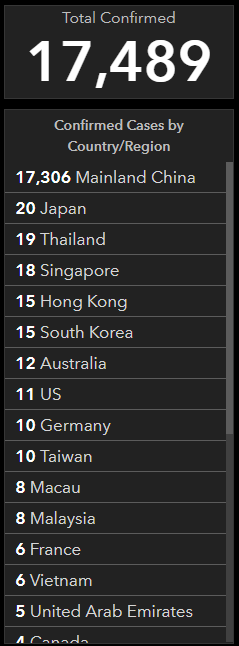
- Since the table and map both show the number of confirmed cases, I think it would be nice if they used the same color, to visually tie them together.
- They used to show regions (such as provinces in China, and states from the US) in this table. Now that they have changed it to country-level summaries, they could remove 'Region' from the title and save some space.
- If the numbers were right-justified, they would be easier to read and compare.
Total Deaths Summary
The summary count of total deaths is to the right of the map.
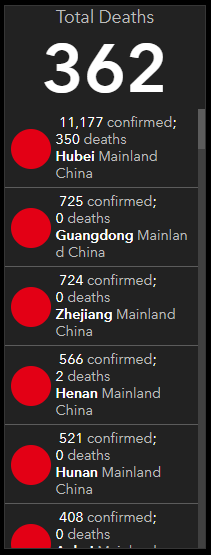
- The biggest problem/confusion is the red bubbles - at first I thought these were somehow tied to the red bubbles in the map ... but maybe not(?). I don't see a need for them. They just add confusion.
- Some of the areas listed in the table have 0 deaths. Why are areas with zero deaths in the table?
- If the table showing the total number of confirmed cases is summarized at the country level, why not summarize the deaths table at the same level?
Total Recovered Summary
The summary count of the number of people who recovered from the virus is located at the far-right of the dashboard.

- If the table showing the total number of confirmed cases is summarized at the country level, why not summarize this recovered cases table at the same level?
Graph
The time series graph is below the map. It shows how the number of confirmed cases has increased over time.
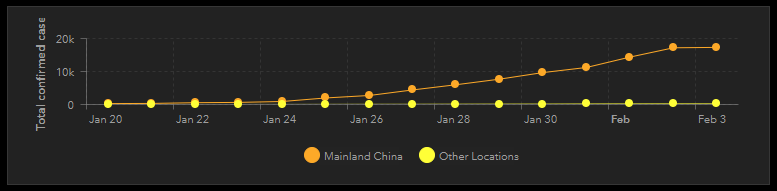
- The biggest problem here is the layout - the graph is so wide and short that you can't tell much about what the data is doing.
- The legend occupies 1/3 of the space (almost 1/2) - the legend could be placed in a different position, and allow the graph to utilize that extra space.
- The sideways label along the y-axis is difficult to read.
The Information Box
There is an information box in the bottom/right corner of the dashboard, with links to information about the dashboard and the data.

- The main problem is that you can't see all the information without scrolling.
My Improved Dashboard!
Here's my new/improved version of the dashboard. Click the image below to see the full-size interactive version, with HTML mouse-over text. If it's too big to fit in your browser, try pressing the "Ctrl" and "-" (minus key) on your keyboard at the same time to shrink it (similarly, use "Ctrl" and "+" to enlarge it again).
Here is a list of my improvements:
- I add a date/timestamp to the title.
- The bubbles in my map all represent country totals (no provinces, etc).
- I show the full world map, and do it in such a way that it fills the entire space.
- I make the countries that do/don't have cases of the virus different shades, in the map.
- I make the numbers in the Total Confirmed table red, so they match the color of the bubbles in the map.
- I make the numbers in my tables right-justified, so they're easier to read and compare.
- I do not include red bubbles in my Total Deaths table.
- I do not show areas in the Total Deaths table, that have not had deaths.
- I summarize at the country level in the Total Deaths and Total Recovered tables.
- I move the legend inside the graph area, freeing up more space for the graph to be taller.
- I place the label above the legend, rather than up/down along the y-axis.
- And I trimmed down the information in the info box, so you can see it all without scrolling.
Discussion
Which of the changes did you like & not like? What other changes would you recommend? Feel free to discuss in the comments section.
I created my prototype dashboard with SAS Software. If you would like to see all the nitty-gritty details, here is a link to the complete SAS code I used.
Update (Feb 5, 2020)
Looks like Johns Hopkins has made several of the improvements I recommended in their dashboard (yay!) Here's a screen-capture of their new/improved dashboard. Looking good Johns Hopkins!
- The numbers in the 'Confirmed' column are now red, to match the red bubbles in the map.
- The red bubbles are now gone from the 'Deaths' column.
- The proportions of the line graph are now much taller.
- They've added a date/timestamp (bottom/left corner).
- You can now read all the main/important items in the information box without scrolling.
- They've changed the title to "Coronavirus COVID-19" (which is the latest name being used in the news).
- You can now zoom-in the map such that it shows all the countries (excluding Antarctica) without big blank margins forcing the countries to be small.
Update (Feb 9, 2020)
Johns Hopkins moved their data from a Google spreadsheet to csv files in GitHub, and changed the format a little. Here is my new SAS code that works with the GitHub data.
Update (Feb 24, 2020)
Now that the virus has spread to many other countries, I have added drill-down links to my dashboard, so you can click the countries in the map, or the country names in the tables, and see a graph of that country's data.
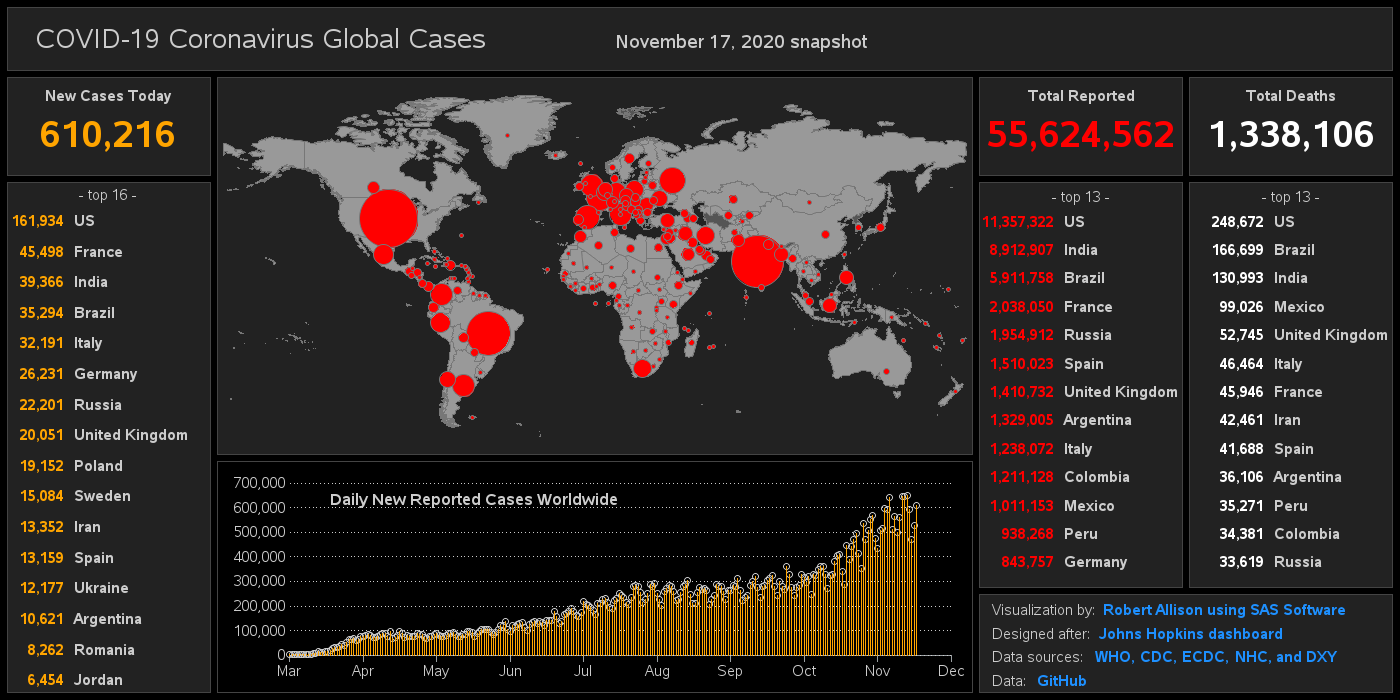
Update (Mar 11, 2020)
Some of my colleagues at SAS have created a Novel Coronavirus Report using SAS Visual Analytics that depicts the status, locations, spread and trend analysis of the coronavirus. Data is updated nightly. The ability to visualize the COVID-19 outbreak can help raise awareness, understand its impact and can ultimately assist in prevention efforts. View the public SAS Coronavirus dashboard to see maps based in ESRI, coronavirus statistics, and an animated timeline of worldwide spread.
LEARN MORE | See all Coronavirus dashboard blog postsUpdate (Mar26, 2020)
Since the Johns Hopkins is no longer reporting the 'recovered' data, I have replaced that column in the dashboard with a column showing the daily increase in confirmed cases.

46 Comments
Great improvement!
Thanks Lex!
it's cool, should we put our version of dashboard for public instead of just screen shot.
When you click the screenshot of my dashboard, it goes to the interactive github version. I plan to update that version with the latest data periodically.
Robert - solid suggestions. Did you spin up a working/interactive dashboard? Can you post a link to that? Thanks!
Yes - click the image of my dashboard in the blog, to see the full-size version with mouse-over text. (I updated the data this morning, with last night's 9pm daily data snapshot).
Yes - the original used a dark color scheme, therefore I used the same dark color scheme.
Is it supposed to be so dark? I had to reverse the colors on my display to see it more clearly.
I like your version better, for all the reasons you mention. However, that is as a single static graph. To enhance it even further, I would suggest making it hierarchical, so with a click on any specific country, the graph automatically zooms to that country, and displays the distribution at the next more detailed level (province, state, region). Then county, then city ... The title should identify the level. Then it could be a template for many other spatial distributions, whether epidemiologic or financial sales results ...
Excellent idea, and a definite possibility. I would need to have the hierarchical data, down to the city level, to make that happen (and, of course, I would need to do a bit more coding). 🙂
I'll 2nd Aaron's suggestion! It was my first thought when I clicked on a country... as I was anticipating seeing that distribution. You've done such a fine job with improving the quality/value of the dashboard that it seems unfinished without at least the State/Province numbers withing the country.
Having the city data would be great if it was easily available, yet, not as desirable as the State/Province information.
This really is well done!
Thanks! I'm making (almost) daily improvements to the dashboard, and am considering all suggestions!
Thanks looks great, very useful.
I wouldn't mind seeing newly reported cases in time, basically the daily derivative of the cumulative plot. I think this is important to gauge if the disease is spreading faster or slower hopefully. ie. are medical initiates getting on top or not,.
Kudos Robert! Please keep this "Live" and online for as long as the situation is ongoing.
Great post and cool Improvements. Just one point - The WHO explicitly discourages naming epidemics or viruses after locations, people etc in order not to create unjust and negative associations. I would recommend with the official naming and not to call it Wuhan Coronavirus which
might be perceived as insensitive.
I would really like to see a graph of infected by city or province within China as well other countries over time … any idea if this can be done where I can get the data?
Do you have a suggestion or preference of when to use PROC GREPLAY to produce charts/maps/tables in specific areas of a screen or page, as opposed to ODS REGION statements? I always use ODS REGION statements, but perhaps I should give PROC GREPLAY a try.
In my case, I don't know the new ODS Layout (with ODS Region), so that's the main reason I used Proc Greplay. I haven't spent much time learning ODS Layout yet, because (I think?) it can only be used for output such as PDF(?) ... whereas greplay produces a single png file, with an html overlay for the mouse-over text and drilldowns. - I haven't really checked into ODS Layout much yet, therefore I might be wrong on those details!
What happened to github data?
They have moved it a few times. I try to keep the link in my version of the dashboard updated, and pointing to the latest location. Here it is: https://github.com/CSSEGISandData/COVID-19/tree/master/csse_covid_19_data/csse_covid_19_time_series
Hey Robert!
Nice to find this after the Johns Hopkins ArcGIS license connection stopped working today.
Interesting, Is it real number? There is nothing in India, the second or maybe first now, populated country, or they don't want to give there numbers? There is a red dot at Mumbai but we can't see it in the cumulative list. The improved dashboard is very nice. Can we receive an update by email, twice a month (using real data)?
Today's version of the dashboard has 3 confirmed cases in India. I try to keep my interactive dashboard link updated daily, using the Johns Hopkins latest data.
I would not call it "Wuhan Coronavirus". Agree with WHO on naming the virus NOT using the city/country name.
Excellent upgrade! First time I saw the JH dashboard, I thought it would be awesome to include age groups somewhere in there. This of course would be to show which age-groups are more susceptible to contacting the virus. May be a version 2 from you could include that... 🙂
That would be interesting - but I would have to find a source for data by age (the Johns Hopkins data does not have age in it).
I agree with all of your improvements. One thing I think that would be interesting would be to also include a stat that shows the outcomes over time. I'm not a health data expert, but I'm assuming that people look at the deaths and recoveries as a point in time measure of the deadliness of the disease. Something like, of the cases with outcomes (deaths + recoveries) x% are deaths. But, of course using recognized official mortality equations if they exist. This is the first number I calculated after looking at this for a bit. I think also that if a vaccine is introduced, we should see a distinct change in the mortality and that would be of interest both globally, and specific to each country.
I haven't seen exactly how they calculate mortality rates, but I'd like to include something about that in the dashboard as a future enhancement! 🙂
Robert, this is great!
It might be interesting to color the points on the map by change over time, so its easier to see where the new hot sports.
I've tried to do something like that but I'm sure there is a better way.
https://devlive15.jmp.com/packages/Coronavirus-COVID-19-Global-Cases/js-p/L2GP75YdZpS4_9j7xm709
Neat map animation Byron! - Your color-coding will be even more interesting, as the virus starts increasing (and decreasing) in other countries!
I've been following this dashboard daily - thanks! When I refreshed it today, it was still showing a snapshot from 11th March, but with lower figures than before, notably for the US. Has someone been re-writing history?
They refresh their data nightly, and I refresh my dashboard in the morning. It's still pretty early in the eastern US timezone (7:30am), so I haven't refreshed with last night's data yet. The US numbers were high yesterday because John's Hopkins started adding extra lines to their data (they used to just have city/county numbers, but now they also added state summary numbers ... so when I sum'd them it was double-counting ... I tweaked my code yesterday afternoon with a data-work-around).
Glad to hear there was an innocent explanation - thank you.
That's great stuff, Rob !
Where I struggle is getting a relative death comparison for say 2017 / 2018 / 2019 / 2020
And specifically by death... as the death rate seems the definitive measurement of a virus's seriousness.
If the current "pandemic" is not a serious as other years then I think the Media and Governments have a lot to answer for.
Cheers s.
i was here to say something similar. since many people think the crisis as being overplayed, " it is no worse than the seasonal flu", ia comparison would be telling.
if the covid dashboard was used for the 2018-2019 influenza season, how would it be different, similar?
As with a lot of "ideas" for data visualization, the hard part is getting the data - I'm not sure where I could get daily flu counts for all the countries of the world, like Johns Hopkins has compiled for the coronavirus (they have done a lot of data "heavy lifting" to prepare this data that they graciously let everyone use!)
This debate is going on in many countries.
On the following page, in Dutch, https://nos.nl/artikel/2331577-cbs-ziet-coronasterfte-teruglopen-ook-in-de-verpleeghuizen.html, you will find a graph (titled "Sterftecijfer per jaar") showing the total number of deaths (so all causes) per week, for 2020 and the past three years.
The yearly influenza was particularly strong in 2017, but this year shows quite something else, the line still going up for some time despite all the lock-down measures.
Interesting!
Great work.
I tried to do something similar, and thankfully used your code to get started.
I wonder about the data for France and the UK.
In the John Hopkins data, a few countries have records with values for the Province_State level. For some this really is data at a lowel level, and you have to aggregate them all to get the number for the country: Australia, Canada, China.
For the other countries there already is a record with a null value for Province_State, giving the total for the main country. The other records for the same Country_Region are in fact separate countries (they have their own ISO country code).
For two countries you correct for this by replacing the Country_Region value by the Province_State: Denmark, The Netherlands.
But I think the same should be done for France and the UK. If I read your code correctly the data for those separate entities are added to the main country.
I would add the following line to the DATA Step:
if country_region in ( 'Netherlands' , 'Denmark' , 'France' , 'United Kingdom')
and province_state ^= ''
then country_region = province_state ;
Thanks for the tip! - Sounds like you've spent quite some time studying this data!
I had the advantage having had to look into countries and country codes before 😉
I now have created my own graph showing the number of daily deaths relative to the population, and with the curve for each country starting at the moment the total number passed 1 per million.
It's here: https://frankp.home.xs4all.nl/covid-19/covid-19.html
(The subset of countries is my personal preference, but can be changed easily, it's just a list of ISO-codes in a Where option.)
I intend to refresh it each morning (I would love to update it automatically, the download goes well with an URL filename, but the FTP-upload to the webserver from within SAS does not work for some reason).
Anyway, it was a chance to update my SGPLOT knowledge...
Cool article and even cooler that JH implemented some
Nice article, Robert! Thanks for sharing!
Thanks! - That means a lot, coming from you! 🙂
Pingback: Pandemic code samples, for SAS graphics - Graphically Speaking