Being so close before Christmas I thought it would be a good idea to see what route Santa Claus is planning this year. Not just because I'm living in Australia and Santa usually comes in t-shirts & shorts but also because it's a long way to get down here. So maybe SAS can help here by applying some advanced analytics to optimize his busy tour schedule?
So where to start. A website called Travel by GPS has a web page dedicated to tracking Santa. They also offer to download Santa's route as Google Earth KML file. Perfect! So let's have a look what the current route looks like.
Creating XML map files for Google Earth KML
The simplest way of importing XML documents into SAS is by using the XML Libname Engine. The way the engine maps XML tags into individual columns is by using a XML map file. The following code snippet creates a temporary map file which is referenced by the XML libname statement.
/* Generate the XML map to import graph attribute keys from the XML */
filename keymap temp;
data _null_;
  infile datalines truncover;
  file keymap;
  input line $1000.;
  put line;
datalines4;
<?xml version="1.0" encoding="utf-8"?>
<SXLEMAP name="KMLMAP" version="2.1">
  <TABLE name="route">
    <TABLE-PATH syntax="XPathENR">/kml/Document/Placemark</TABLE-PATH>

    <COLUMN name="name">
      <PATH syntax="XPathENR">/kml/Document/Placemark/name</PATH>
      <TYPE>character</TYPE>
      <DATATYPE>string</DATATYPE>
      <LENGTH>50</LENGTH>
    </COLUMN>
    <COLUMN name="description">
      <PATH syntax="XPathENR">/kml/Document/Placemark/description</PATH>
      <TYPE>character</TYPE>
      <DATATYPE>string</DATATYPE>
      <LENGTH>500</LENGTH>
    </COLUMN>
    <COLUMN name="coordinates">
      <PATH syntax="XPathENR">/kml/Document/Placemark/Point/coordinates</PATH>
      <TYPE>character</TYPE>
      <DATATYPE>string</DATATYPE>
      <LENGTH>50</LENGTH>
    </COLUMN>
  </TABLE>
</SXLEMAP>
;;;;
filename graph "Naughty_and_Nice.kml" encoding="utf-8";
libname graph xmlv2 xmlmap=keymap access=readonly;
Import Google Earth KML data into SAS
Since the libname already gives us access to the XML document as SAS data set - it would be just a matter of referencing the table via a Data Step. However looking at the actual content - it appears columns such as description contain some unnessary HTML tags.

So let's extend a data step here to perform some minor data manipulation using Perl Regular Expressions. We are also going to split the coordinates into two individual numeric columns so we can reference these later within SAS Visual Analytics.
data route; length stop 8.; set graph.route end=last; stop = _n_; /* remove carriage returns */ description = prxchange('s/(\n|\r)//', -1, description); /* create regular expression to catch the text between the tags*/ retain re; if _N_ = 1 then do; re = prxparse('/(?)(.*?)(?=)/'); end; /* extract the text */ if prxmatch(re, description) then do; description = prxposn(re, 1, description); end; /* split coordinates in lat/lng */ length lat 8. lng 8.; lng = input(scan(coordinates,1,","),8.); lat = input(scan(coordinates,2,","),8.); /* add a link to the next stop */ length next_stop 8.; if not last then next_stop = stop + 1; /* throw away things we don't need */ drop re coordinates; run; |
Calculate distance between two route points
To understand Santa's route it would be beneficial to see the actual distance he needs to travel between two points. SAS provides a great geodist function to do so. And finally we are also going to create a route from one stop to the next by joining the table with itself.
proc sql noprint; create table Naughty_and_Nice as select a.stop label="Stop", a.next_stop label="Next Stop", a.name label="Client", a.description label="Description", a.lat label="Latitude", a.lng label="Longitude", b.lat as next_lat label="Next Latitude", b.lng as next_lng label="Next Longitude", geodist(a.lat, a.lng, b.lat, b.lng) as distance label="Distance (km)" from route a left join route b on a.next_stop eq b.stop order by a.stop ;quit; |
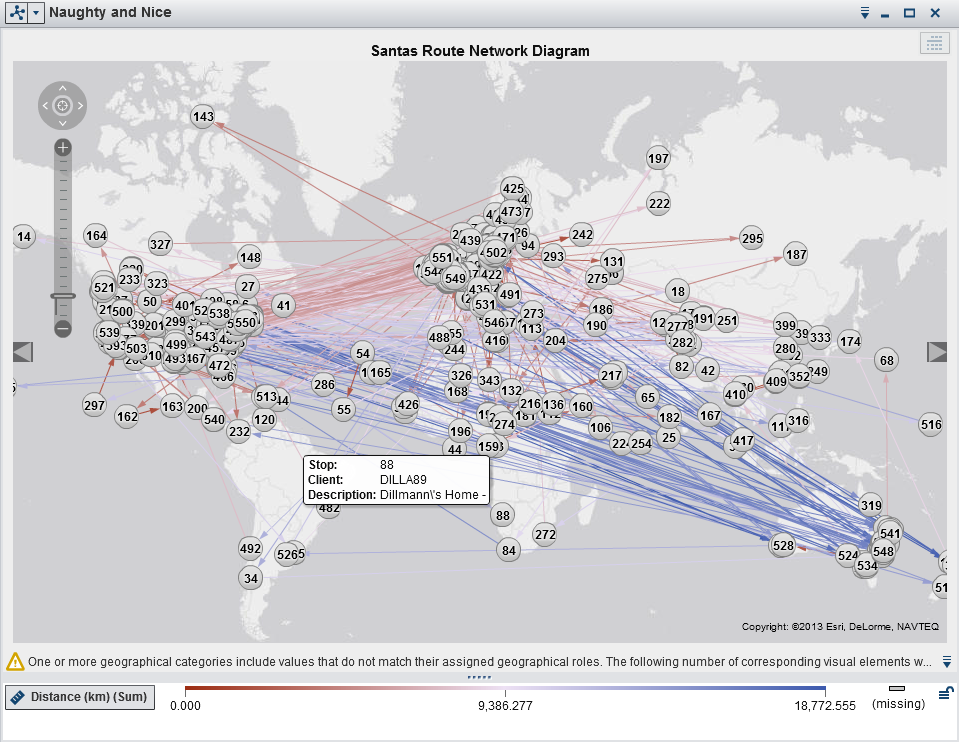
Explore the data with SAS Visual Analytics
Loading the data into SAS Visual Analytics Explorer and applying coordinates to our route stops reveals the un-optimized route Santa would take if he would simply go from one stop to the next according to the order in our data base. Based on the color legend it appears the maximum distance between route stops can be as long as 18,000 km. Considering the circumference of the earth at the equator is 40,076 km (24,902 mi) it would suggest Santa needs to travel halfway around the world to reach the next stop - clearly we should be able to optimize this route!
Optimizing Santas Route
SAS provides network optimization algorithms as part of SAS/OR. So let's apply the typical Traveling Salesman Problem to our Santa route. The first SQL statement creates a list of all possible pairs of potential stops. The following PROC OPTNET call will take the challenge and create the optimal route for Santa.
/* Create a list of all the possible pairs of potential stops */ proc sql noprint; create table Naughty_and_Nice as select a.stop label="Stop", a.name label="Client", a.description label="Description", a.lat label="Latitude", a.lng label="Longitude", b.stop as next_stop label="Next Stop", b.lat as next_lat label="Next Latitude", b.lng as next_lng label="Next Longitude", geodist(a.lat, a.lng, b.lat, b.lng) as distance label="Distance (km)" from route as a, route as b where a.stop ne b.stop order by a.stop ;quit; /* Find optimal tour for Santa using OPTNET */ proc optnet data_links = data.naughty_and_nice out_nodes = TSPTourNodes; data_links_var from = stop to = next_stop weight = distance; tsp out = TSPTourLinks; run; |
My slightly ageing computer managed to solve this puzzle in a bit more than an hour.
NOTE: ------------------------------------------------------------------------------------------------ NOTE: Running OPTNET version 13.1. NOTE: ------------------------------------------------------------------------------------------------ NOTE: Data input used 0.23 (cpu: 0.23) seconds NOTE: The number of nodes in the input graph is 551. NOTE: The number of links in the input graph is 151525. NOTE: ------------------------------------------------------------------------------------------------ NOTE: Processing the traveling salesman problem. NOTE: The initial TSP heuristics found a tour with cost 189274.24153 using 3.77 (cpu: 3.42) seconds. NOTE: The MILP presolver value NONE is applied. NOTE: The MILP solver is called. NOTE: The MILP solvers symmetry detection found 146616 orbits. The largest orbit contains 15 variables. NOTE: The MILP solver added 155 cuts with 542405 cut coefficients at the root. NOTE: Optimal within relative gap. NOTE: Objective = 179509.55266. NOTE: Processing the traveling salesman problem used 4116.06 (cpu: 4090.08) seconds. NOTE: ------------------------------------------------------------------------------------------------ NOTE: Data output used 0.02 (cpu: 0.00) seconds. NOTE: ------------------------------------------------------------------------------------------------ NOTE: The data set WORK.TSPTOURNODES has 551 observations and 2 variables. NOTE: The data set WORK.TSPTOURLINKS has 551 observations and 3 variables. NOTE: PROCEDURE OPTNET used (Total process time): real time 1:08:36.57 cpu time 1:08:31.34 NOTE: There were 551 observations read from the data set WORK.TSPTOURLINKS. NOTE: The data set DATA.TSPTOURLINKS has 551 observations and 3 variables. |
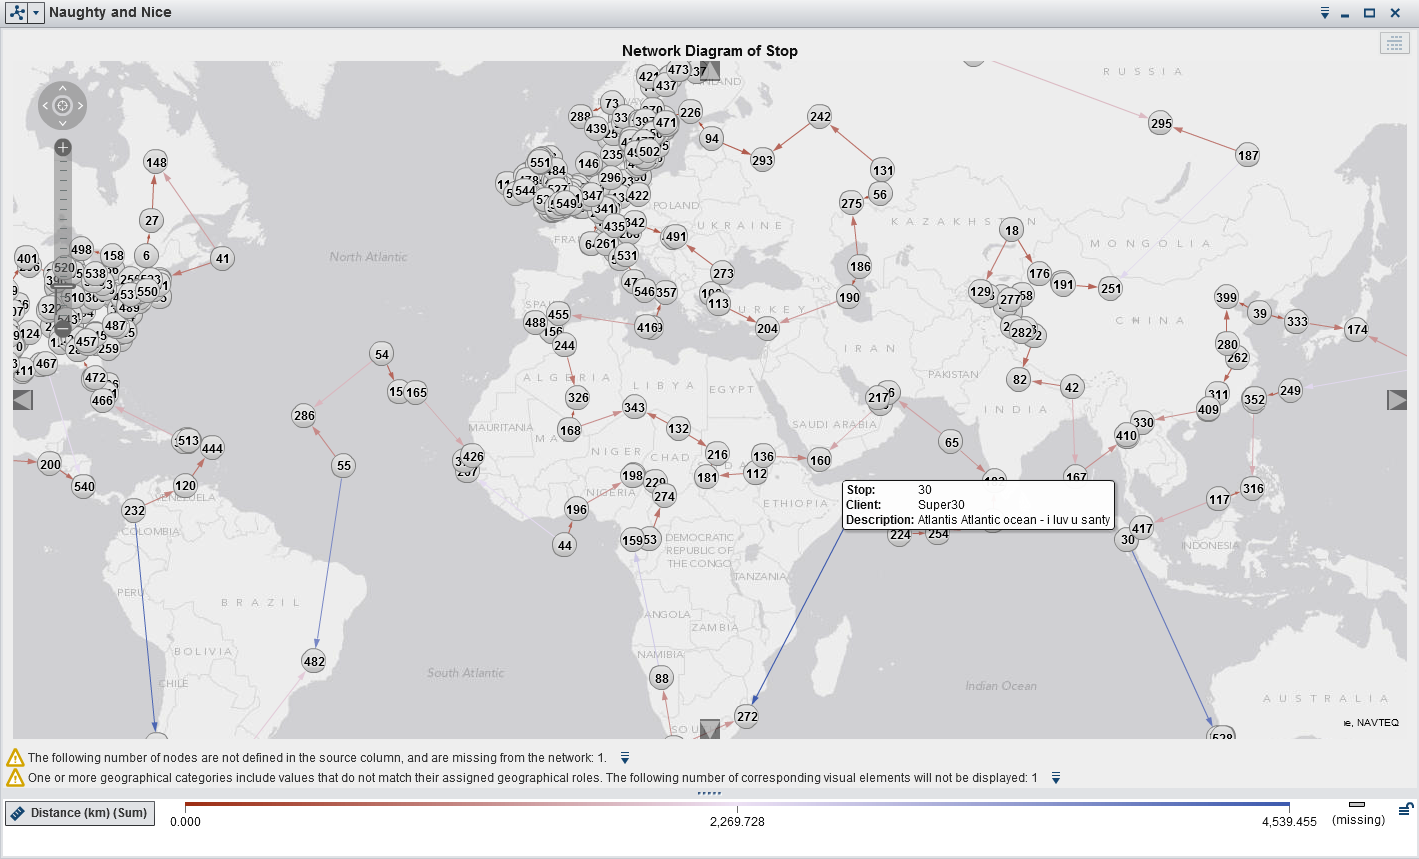
Optimal Santa route in SAS Visual Analytics
Reloading our new optimized data set shows the new route Santa should take.
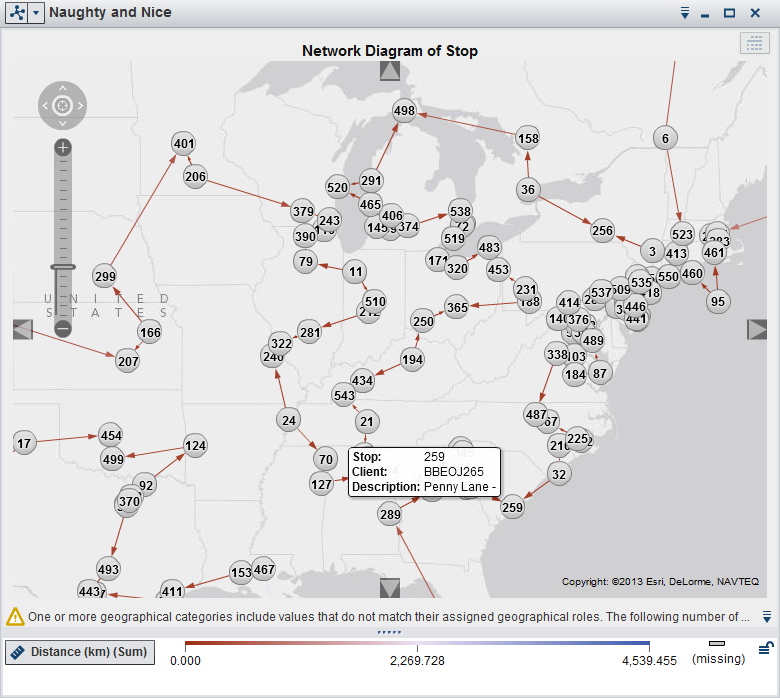
A closer look to North America shows how Santa is travelling across the states.
Combining advanced visual analytics with network optimization algorithms show the great potential a system can deliver. The challenge to find the shortest possible route applies to many industries including planning, logistics, manufacturing, genomics, etc. Although solving the routing problem for Santa Claus has its own special meaning.
Merry Christmas Everyone!

11 Comments
Falko - a quick update. At version 13.2, PROC OPTNET now solves your TSP to optimality in 594 seconds. I decided to revisit your problem, after writing the: Santa's Gift Assignment Problem blog post.
Pingback: SAS/OR - Santa's Gift Assignment Problem
Good post, Falco.
Could you please explain how to use NAVTEQ maps in SAS VA?
I also want to use vectors on the map. How can I make it?
Hi Nikolay. SAS Visual Analytics doesn't support NAVTEQ maps directly although map providers such as Esri and OpenStreetMap are supported. Esri works closely with NAVTEQ as one of its alliance partners so I would assume you can use NAVTEQ maps this way.
SAS Visual Analytics also supports colored polygon overlay (e.g. state / regional boundaries). The environment also comes with GfK GeoMarketing Map Data Sets so referencing locations is just a matter of assigning geo roles in the user interface.
Hope this helps. Cheers, Falko
Pingback: Santa’s information dashboard - The SAS Training Post
Very nice post Falko! A quick comment on the performance of PROC OPTNET at 13.1. It looks like it took ~1 hour to find the optimal routing. If you are satisfied with 'near optimal' you can use the tsp relobjgap= option. If you set it to relobjgap=0.01, this will stop when the route found is within 1% of provable optimal. For this data, on my machine, PROC OPTNET will find a 'near optimal' solution in about 35 seconds. It spends the rest of the time closing that gap to find the true optimal. For practical problems (like Santa), 'near optimal' is usually "good enough".
Great post Falko. Love the detailed steps you've provided.
FYI, in case you want to verify Santa's movements on Christmas Eve to see if he does take the optimal route, check out http://www.noradsanta.org 😉
Pingback: SAS Tech Talk: Developing the SAS Visual Analytics Explorer - The SAS Dummy
Nice blog! - what a great Christmas present to us SAS mapping geeks! 🙂
Nice post. Curious about the general workstream of setting up things in VA. Sounds like you had good ol' SAS code which crunched data, then you uploaded the data to the VA (LASR?) server, where it becomes available to users for analytics. Is that right?
In a real world application (not that santa isn't real), is there typically some sort of ETL job (perhaps even a DI studio job?) in the background which is loading data to the VA server?
Hi Quentin, Yes, I just used good old SAS code to perform the data preparation steps as I wanted to show the detail steps involved (and I know how much SAS users love SAS code ;-)). In a typical SAS Visual Analytics environment you would likely use the SAS Visual Analytics Data Builder application to perform most of these steps including loading data into memory (SAS LASR Analytic Server). While you can use any other SAS application (SAS DI Studio, SAS Enterprise Guide or even SAS Base) the very intuitive data builder application will be the easiest one as it is tightly integrated with the rest of the VA suite and helps getting data into VA in a very ETL-fashion way (UI query design, persist queries as job, scheduling, etc.). But yes, to answer your question - after data is loaded into LASR it becomes immediately available for consumption. Hope this helps. Cheers, Falko